Hello, I'm
Otsiwah Isaac
Web Developer
|
Building secure web applications and financial intelligence
systems that turn complex data into measurable ROI.

About Me

Experience
2+ Years ActiveCompleted
20+ ProjectsSupport
Online 24/7
I'm a Web Developer and Financial Data Analyst with an operational mindset.
My background in transport coordination, entrepreneurship and career advising
taught me how
streamline complex, moving systems. Today, I apply same approach to software architecture and
data modeling.
Over the past 2+ years, I have delivered 20+ projects spinning
responsive web applications,
automated Excel financial models, and executive Power BI and Tableau dashboards.
Whether I am building user-friendly interfaces or uncovering revenue trends across 10,000+
transaction logs,
I code with business purpose to create tools that reduce friction and maximize ROI.
My Experience
Frontend Development
HTML5
IntermediateCSS3
AdvancedJavaScript (ES6+)
IntermediateBootstrap
IntermediateGit
IntermediateReact
IntermediateBackend Development
PHP
IntermediateNode.js
IntermediatePython
IntermediateMySQL
IntermediateSupabase
IntermediateGoogle Apps Script
IntermediateData Analytics
Excel
AdvancedTableau
IntermediatePower BI
IntermediateIBM SPSS
IntermediateGoogle Analytics
IntermediateR-programming
IntermediateWorkplace Skills
CR-T
Critical thinkingA-D
Attention to detailP-S
Problem SolvingCommunication
Adaptability
Collaboration
CA-T
Creative thinkingWhat I Offer
Frontend & UI
Developer
Data Visualization
Specialist
Creative UI/UX
Designer
Recent Works
All
Web
Data
Design

Travel & Tour Platform
Designed an interactive destination discovery and booking flow tailored to boost user exploration for Ghanaian tourism hubs.
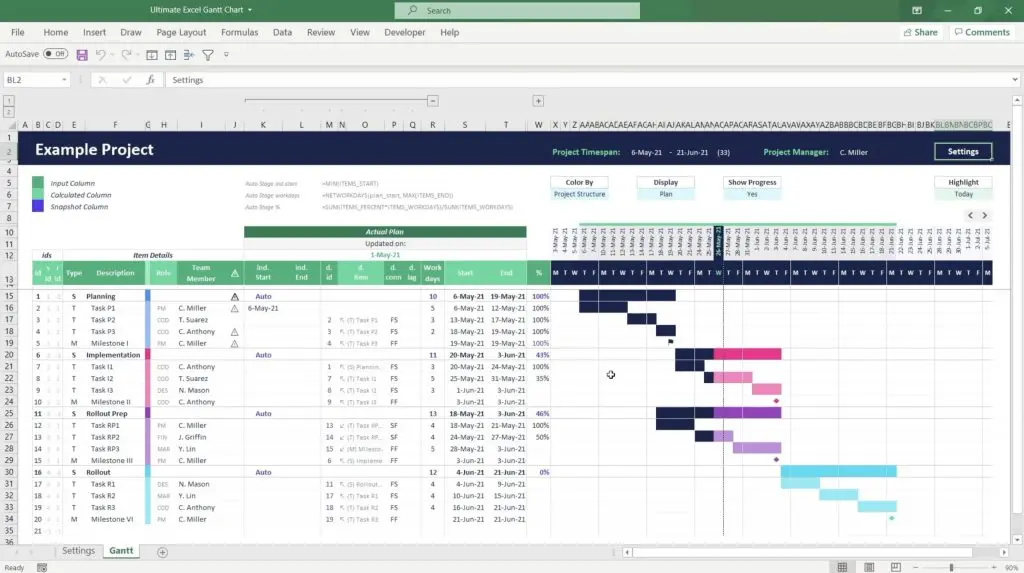
Ultimate Excel Gantt Chart
Dynamic multi-task project timeline and schedule overview.
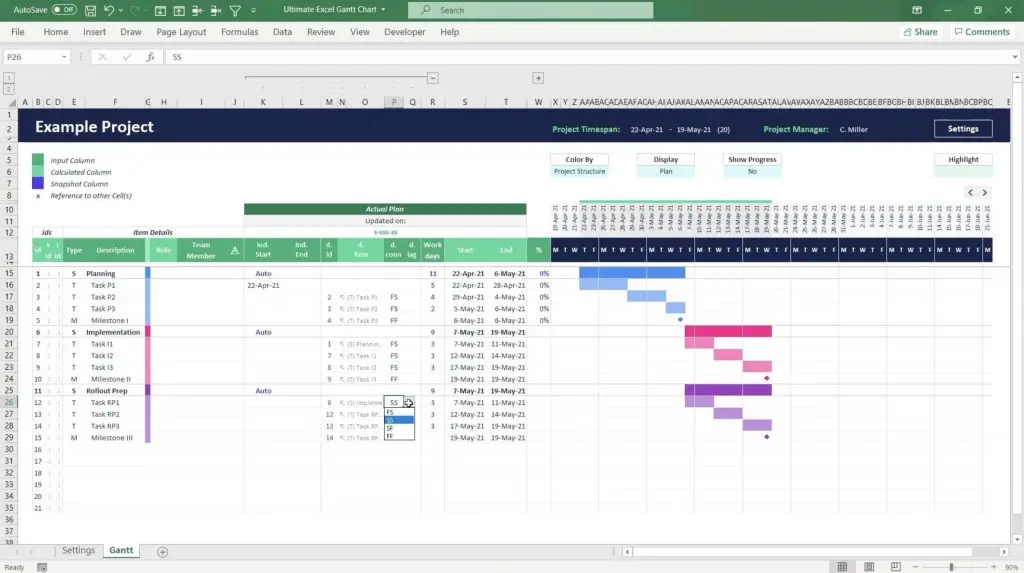
Ultimate Excel Gantt Chart
4 selectable dependencies types to link connected tasks.
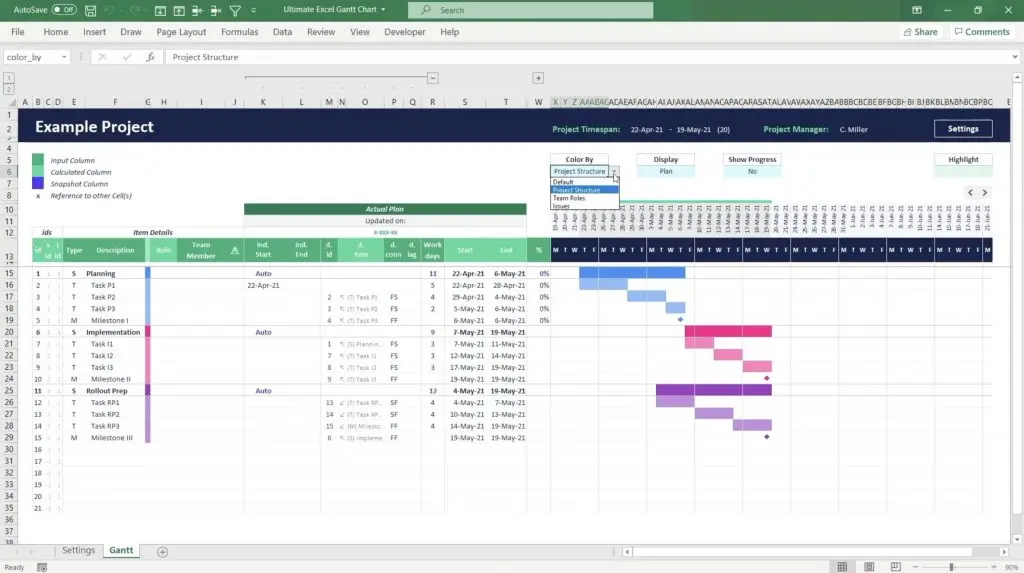
Ultimate Excel Gantt Chart
4 automated color modes for instant status tracking.
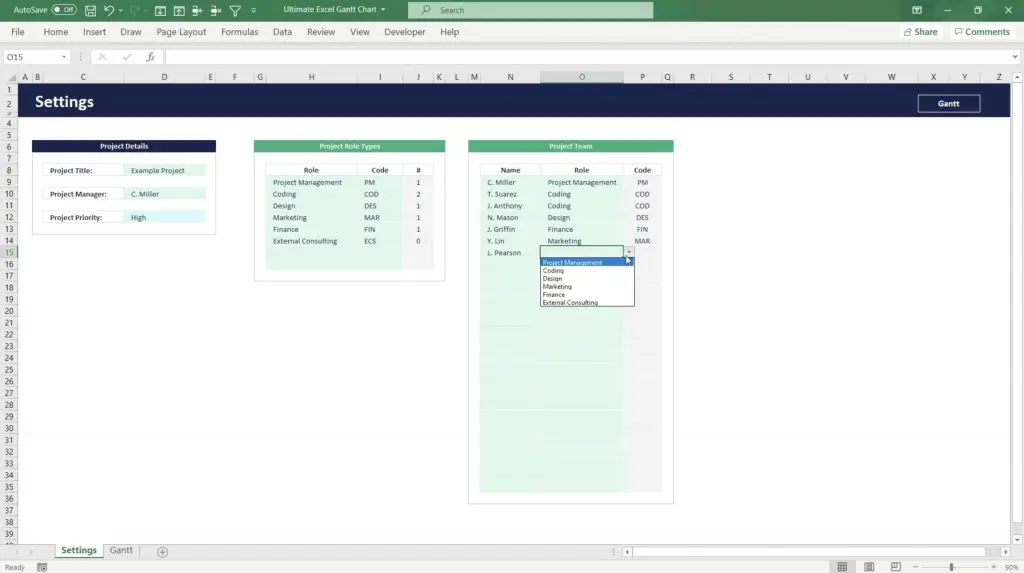
Ultimate Excel Gantt Chart
Team members and project role management directory.
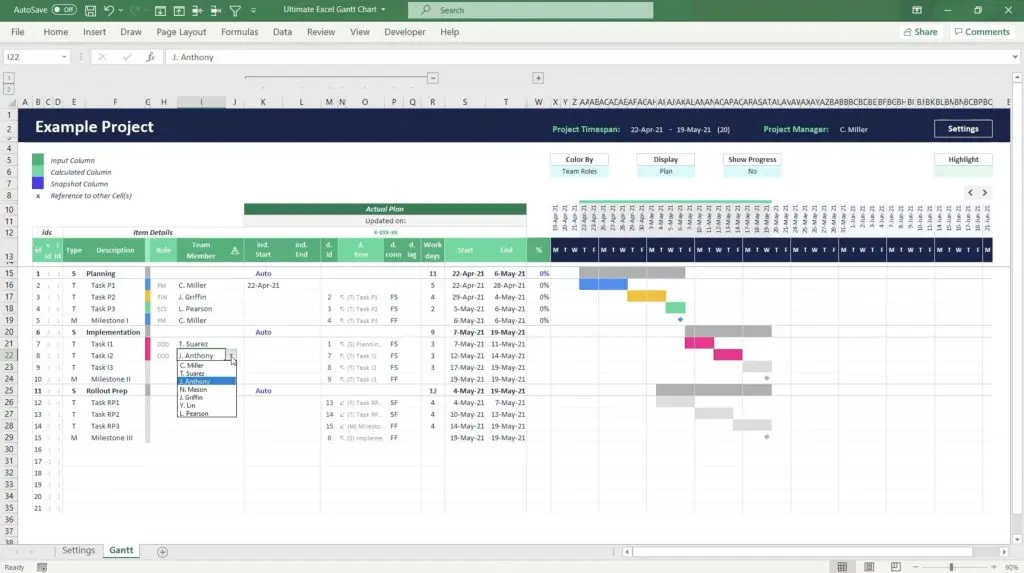
Ultimate Excel Gantt Chart
Direct task assignment and workload distribution view.
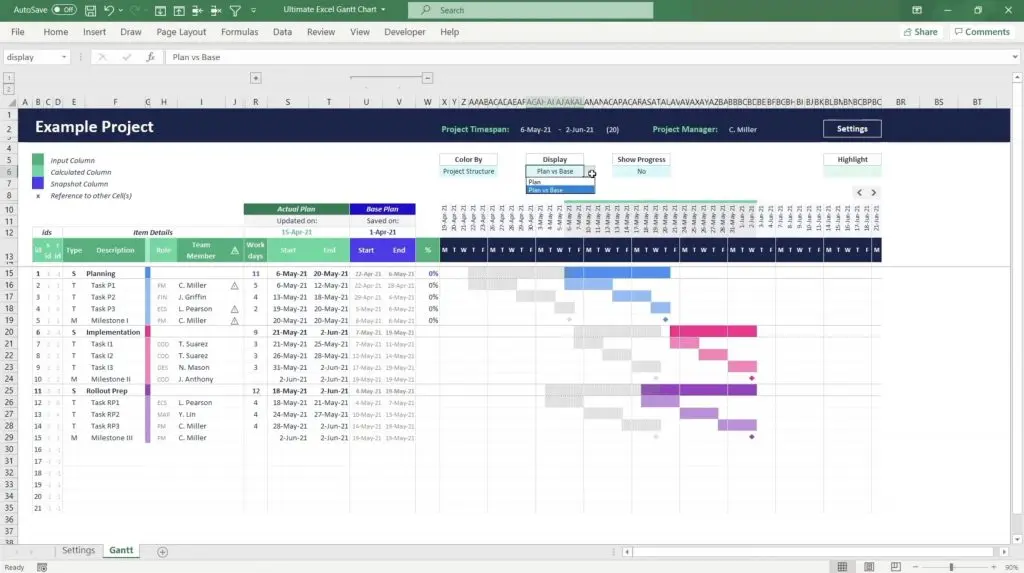
Ultimate Excel Gantt Chart
Baseline vs. actual schedule variance comparison.
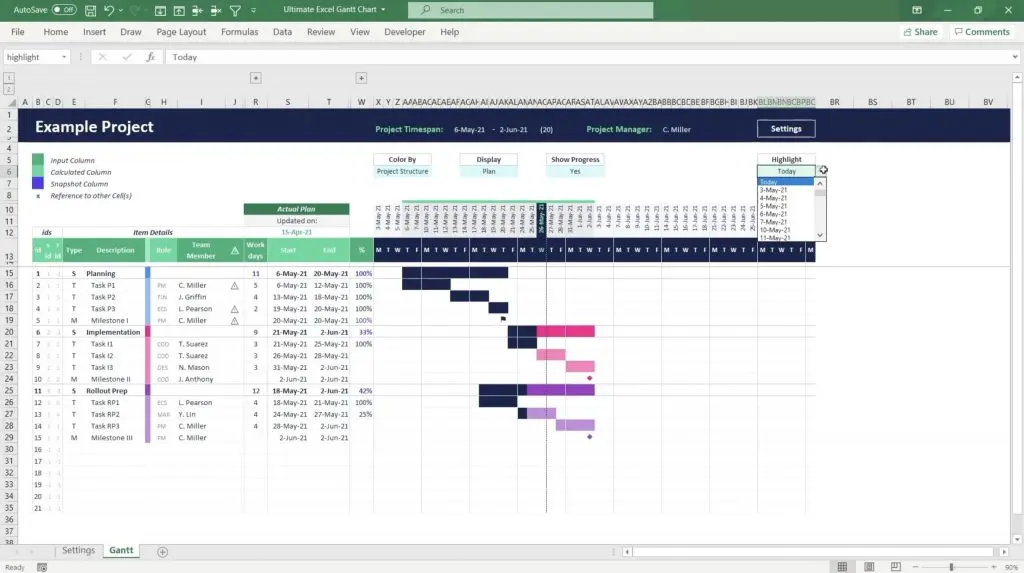
Ultimate Excel Gantt Chart
Dynamic and static date-highlighting controls.
Excel Gantt Chart Sandbox
Enterprise Data Protection Active (Downloads Restricted)Securing Sandbox Connection...
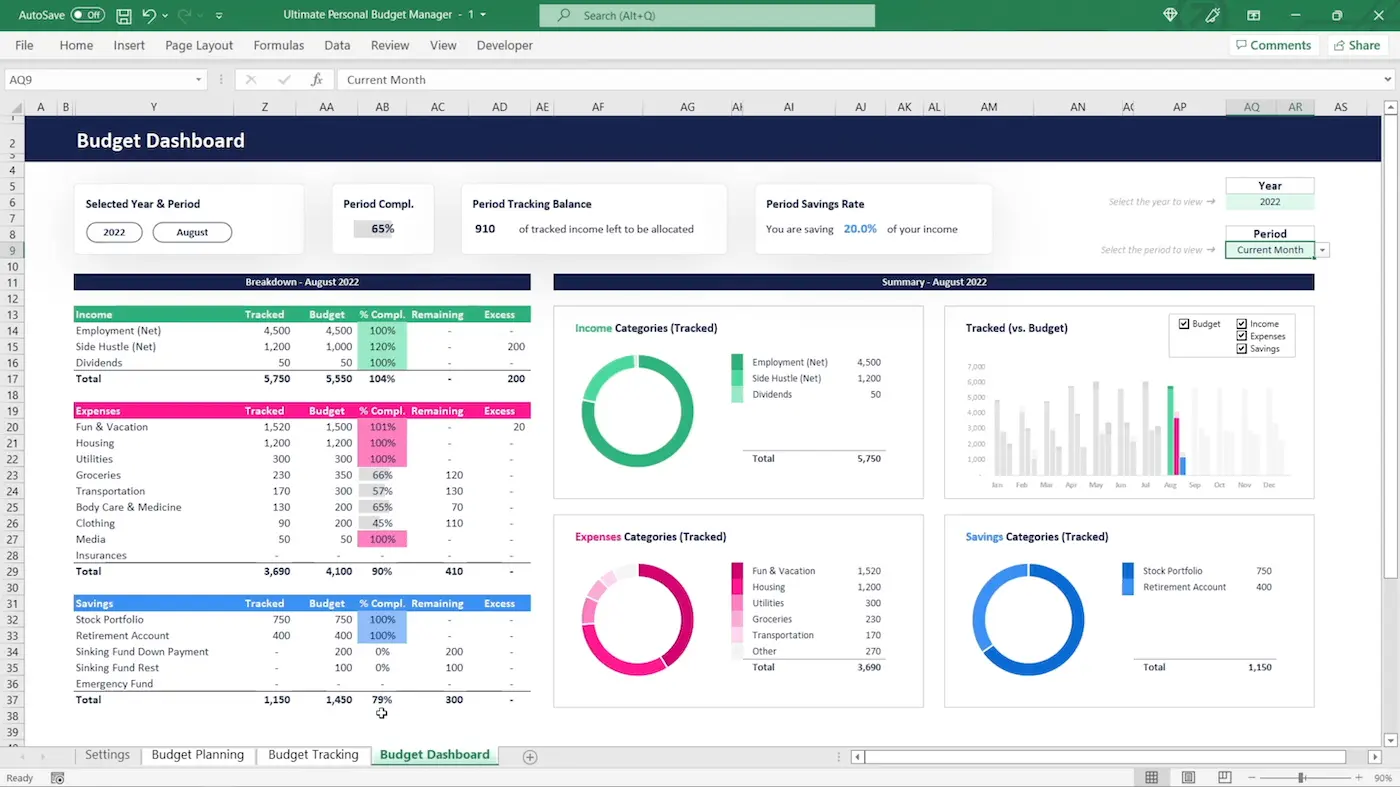
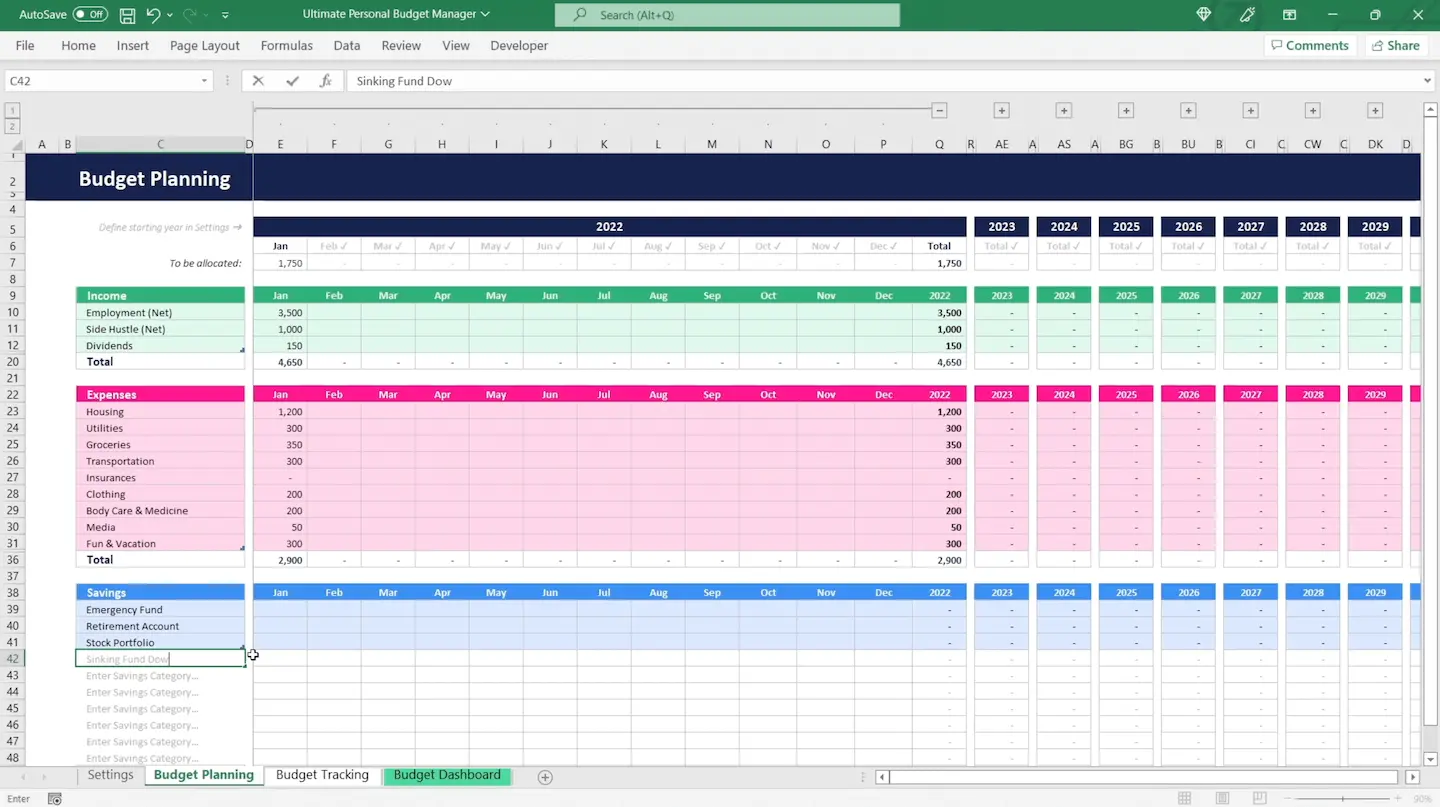
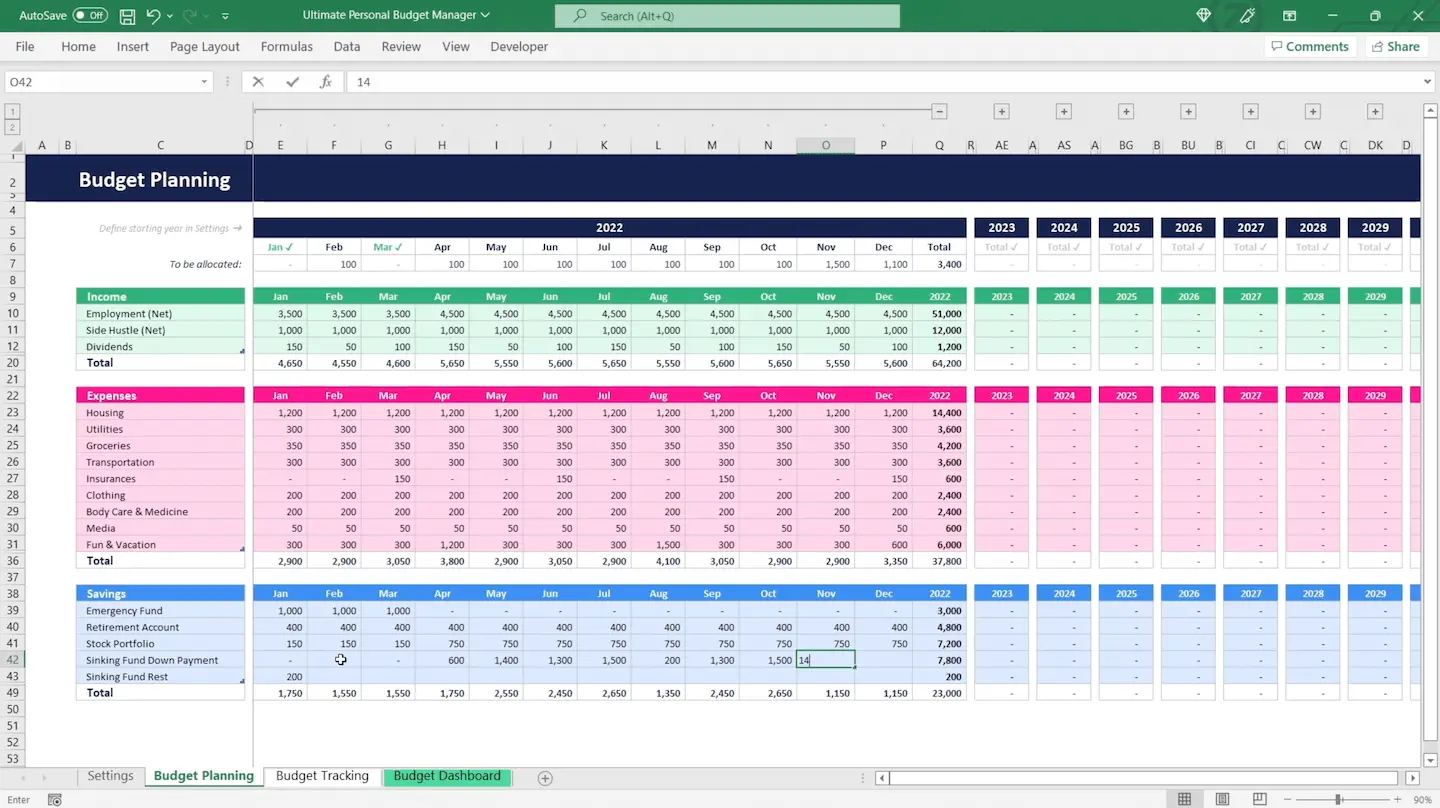
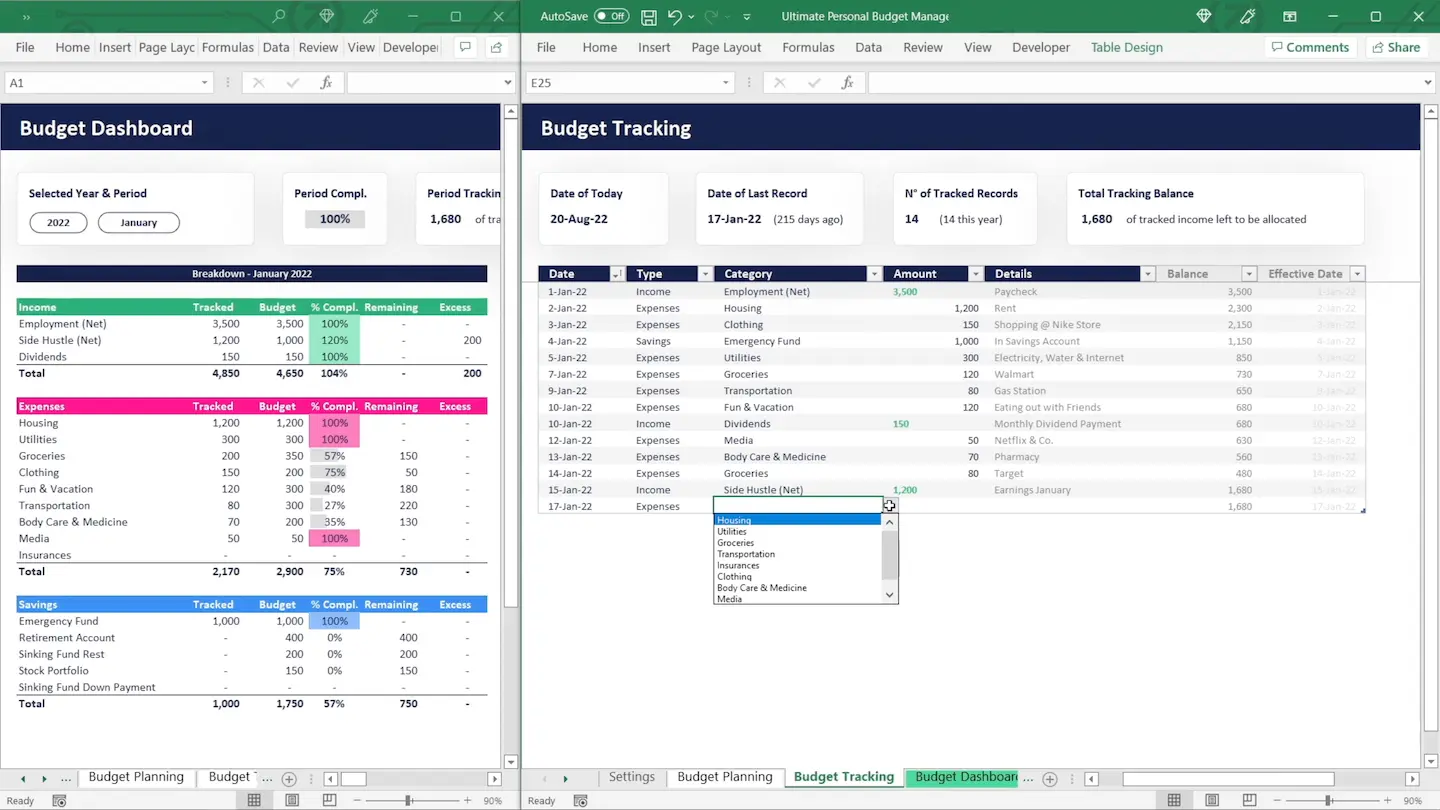
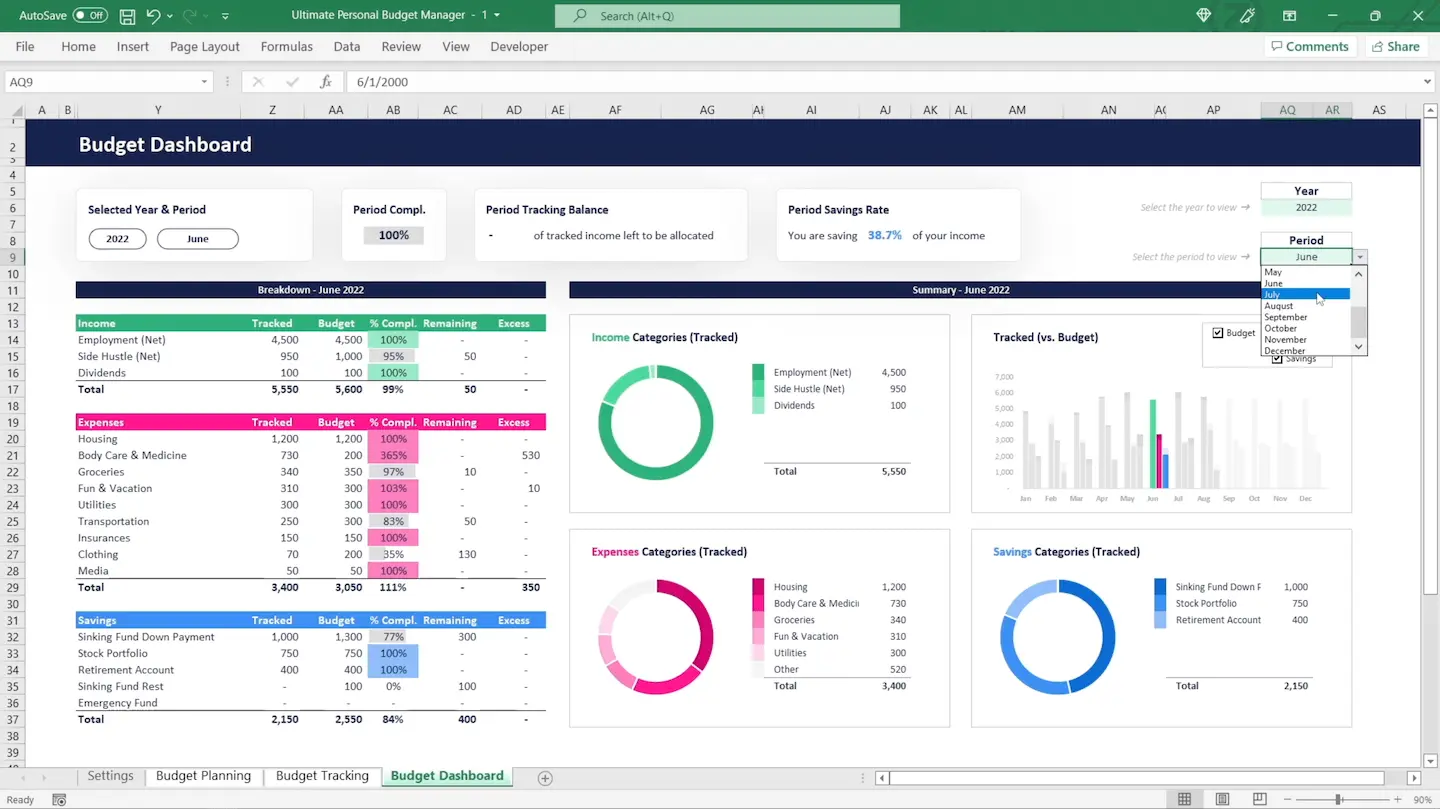
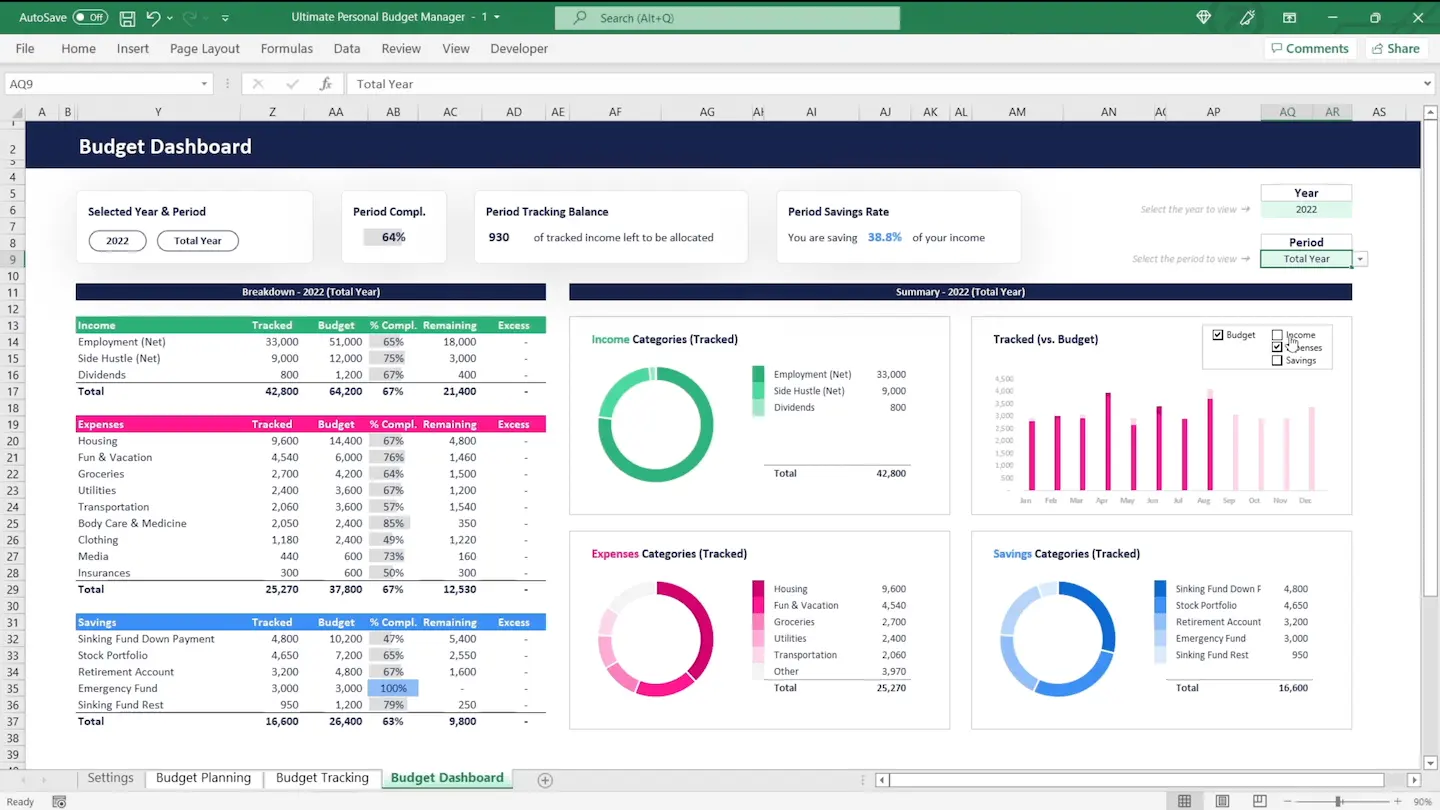
Personal Budget Manager
Engineered a zero-server financial tracker with automated category caps and multi-currency cash flow projections.
Personal Budget Sandbox
Enterprise Data Protection Active (Downloads Restricted)Securing Sandbox Connection...
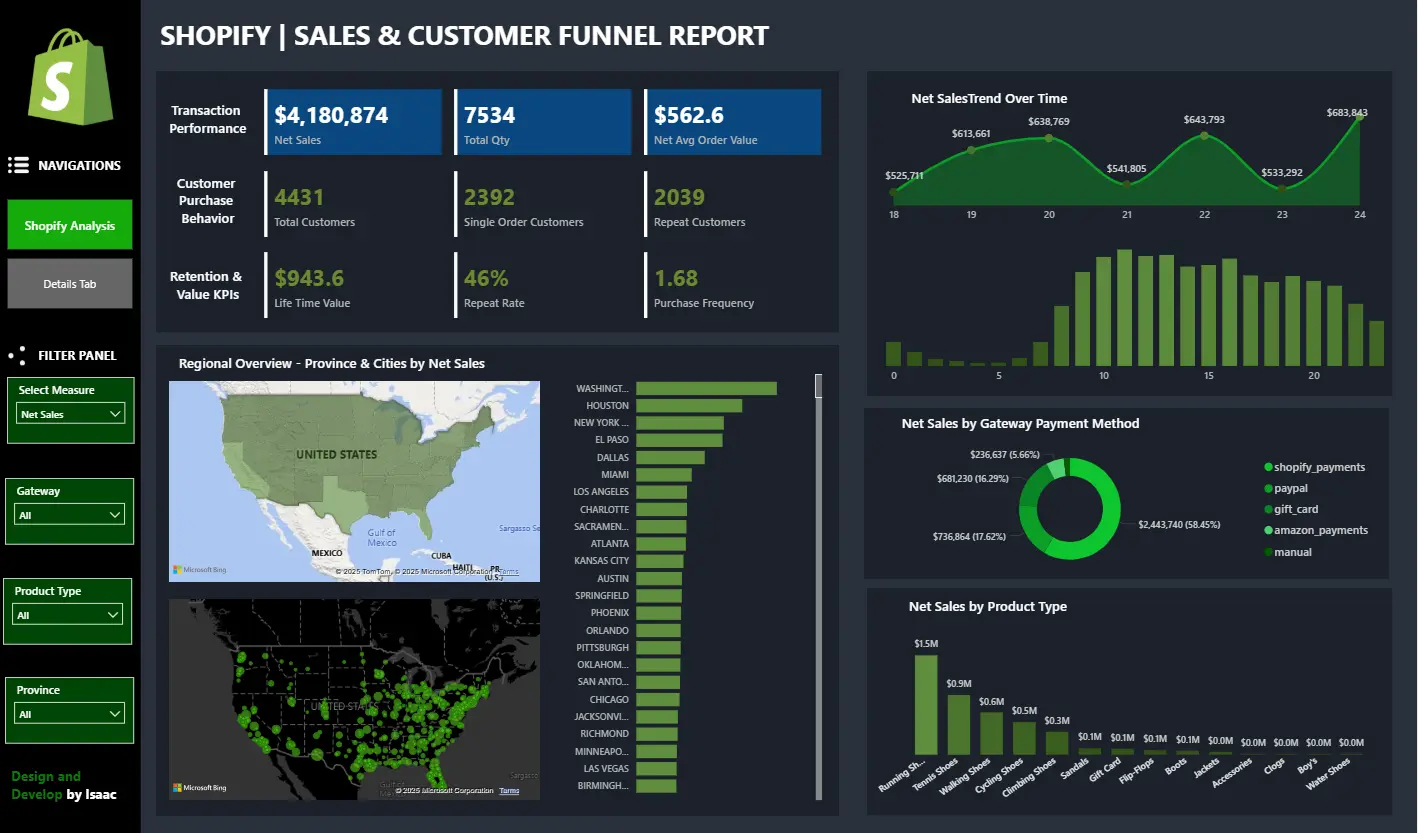
Shopify Power BI
Uncovered customer lifetime value (LTV) trends and pinpointed inventory bottlenecks across 10,000+ transaction logs using custom DAX models.
Shopify Intelligence Hub
Interactive Power BI Engine Deployment ActiveConfiguring Business Intelligence Workspace...

Food Delivery Web App
Developed a responsive ordering interface featuring real-time cart state management and frictionless checkout flows.
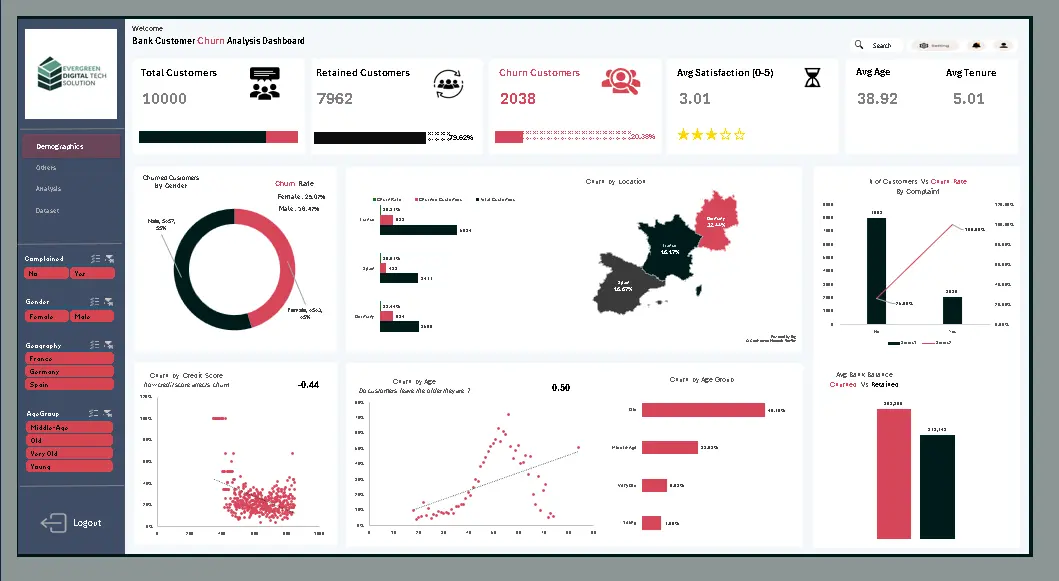
Customer Churn Risk Model
Analyzed subscription churn drivers to predict account drop-offs.
Customer Churn Risk Sandbox
Enterprise Data Protection Active (Downloads Restricted)Securing Sandbox Connection...

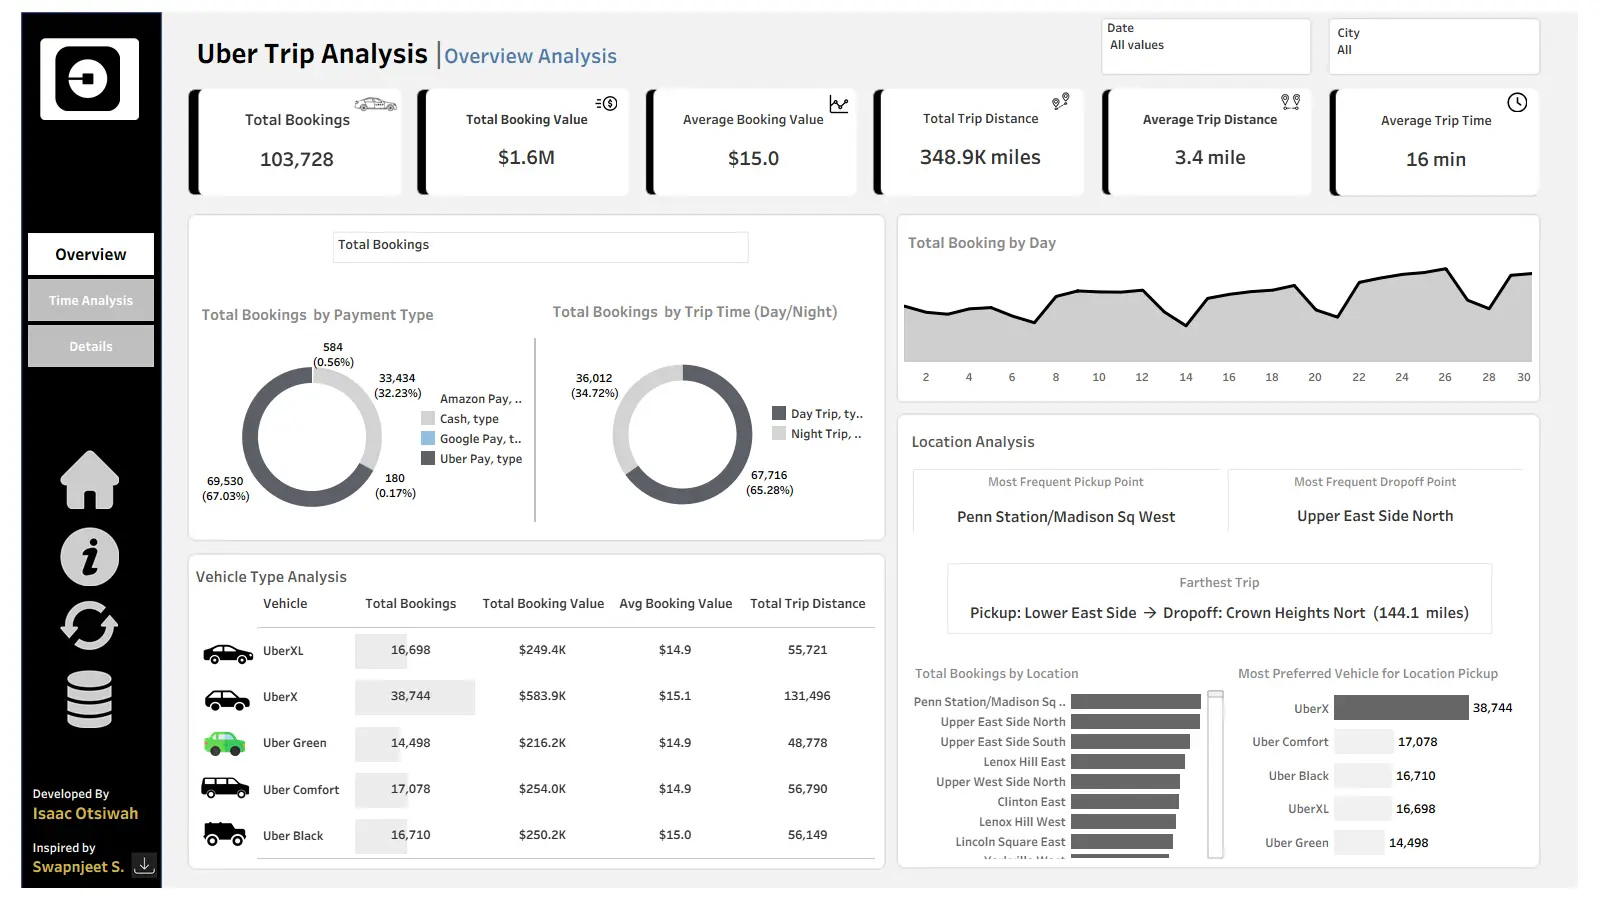
Uber Operations Analysis
Interactive Power BI Engine Deployment ActiveConfiguring Business Intelligence Workspace...
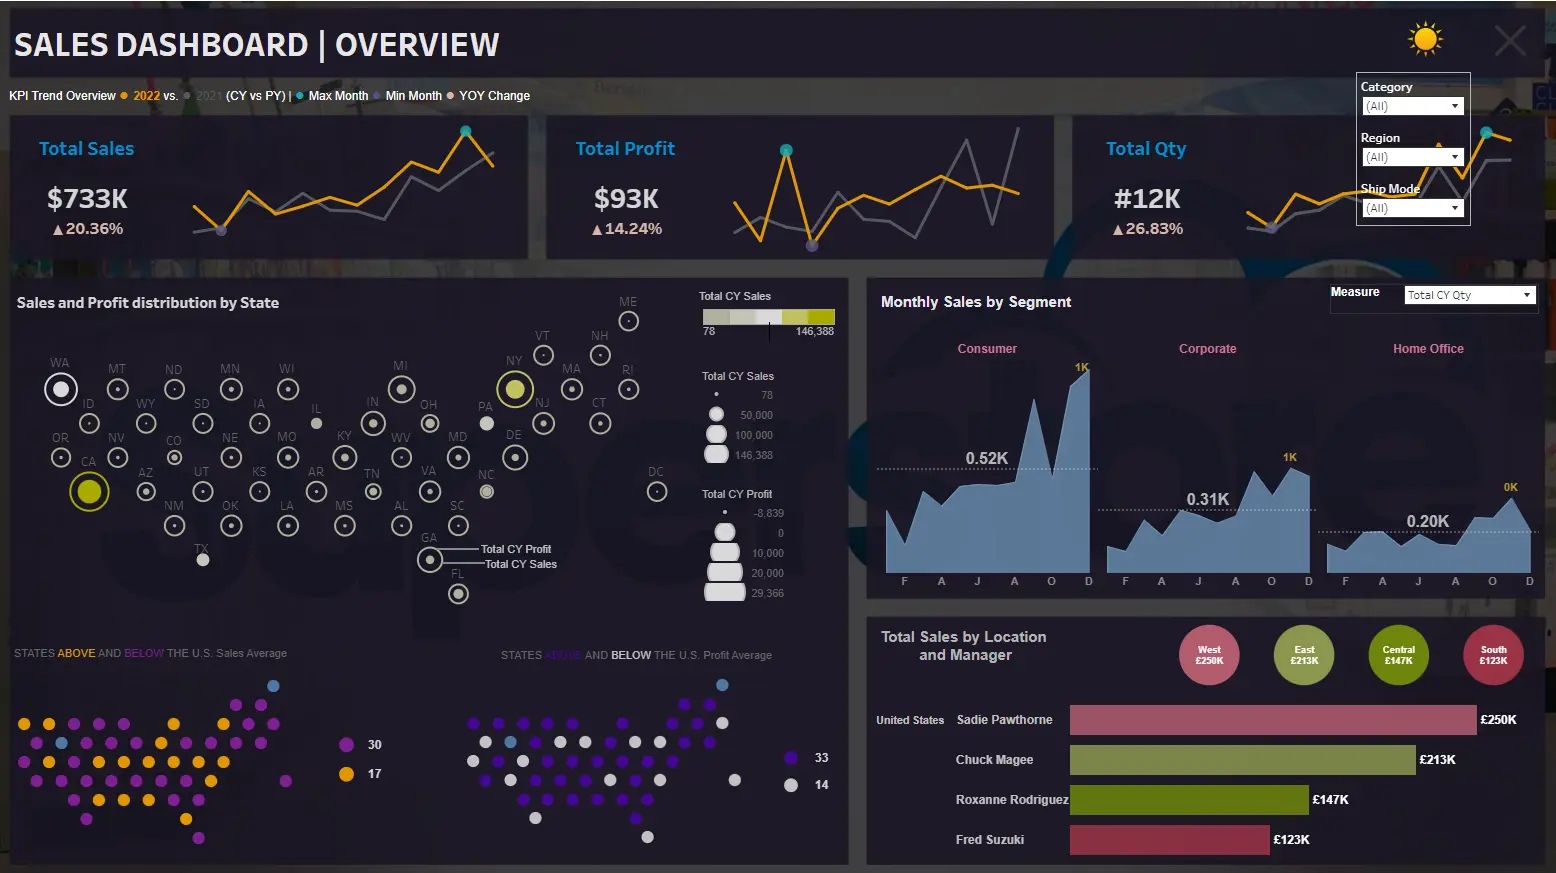
Global Sales Intelligence Canvas
Secure Live Tableau Cloud Deployment Workspace ActiveStreaming Core Analytics Database Clusters...
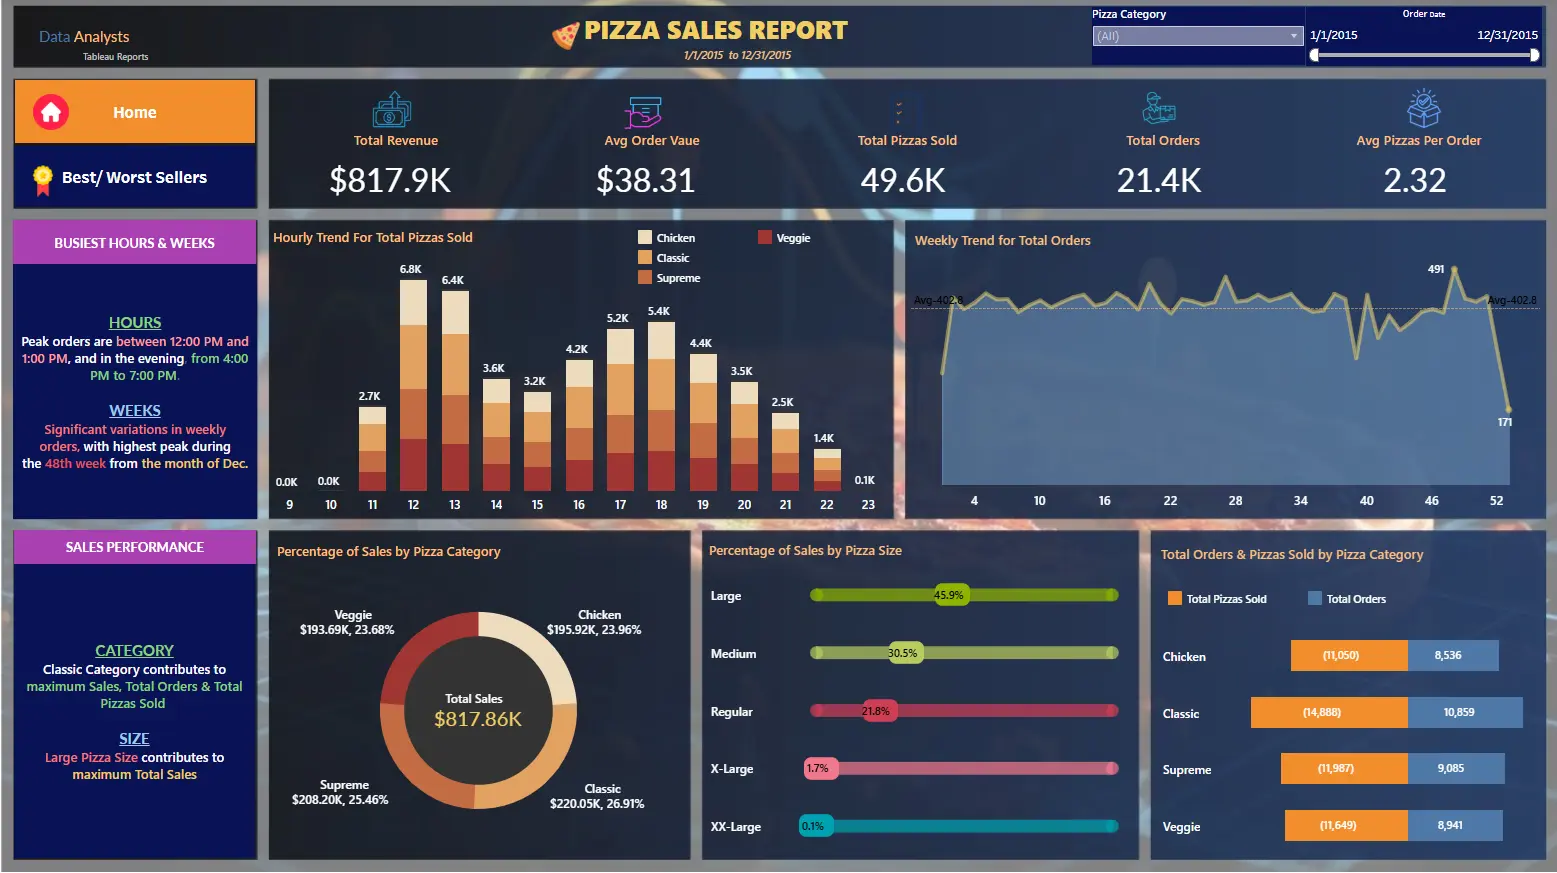
Restaurant & Pizza Sales Analytics Intelligence Canvas
Secure Live Tableau Cloud Deployment Workspace ActiveStreaming Core Analytics Database Clusters...
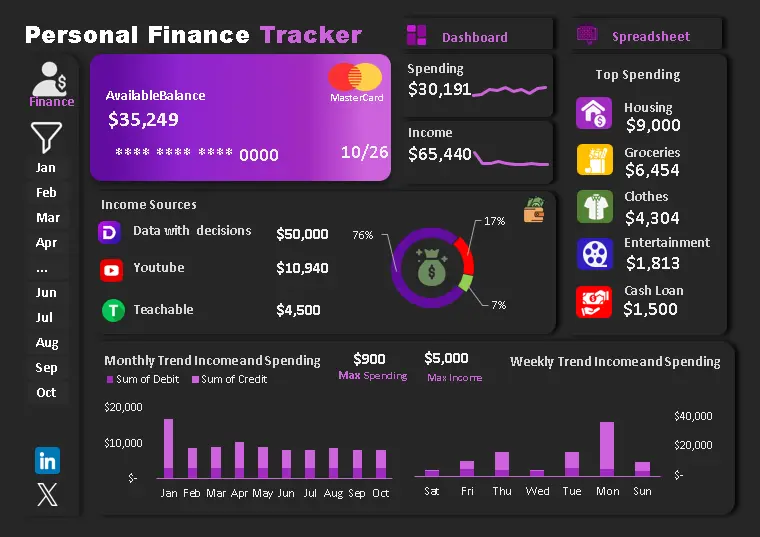
Monthly Cash Flow & Expense Tracker Sandbox
Enterprise Data Protection Active (Downloads Restricted)Securing Sandbox Connection...
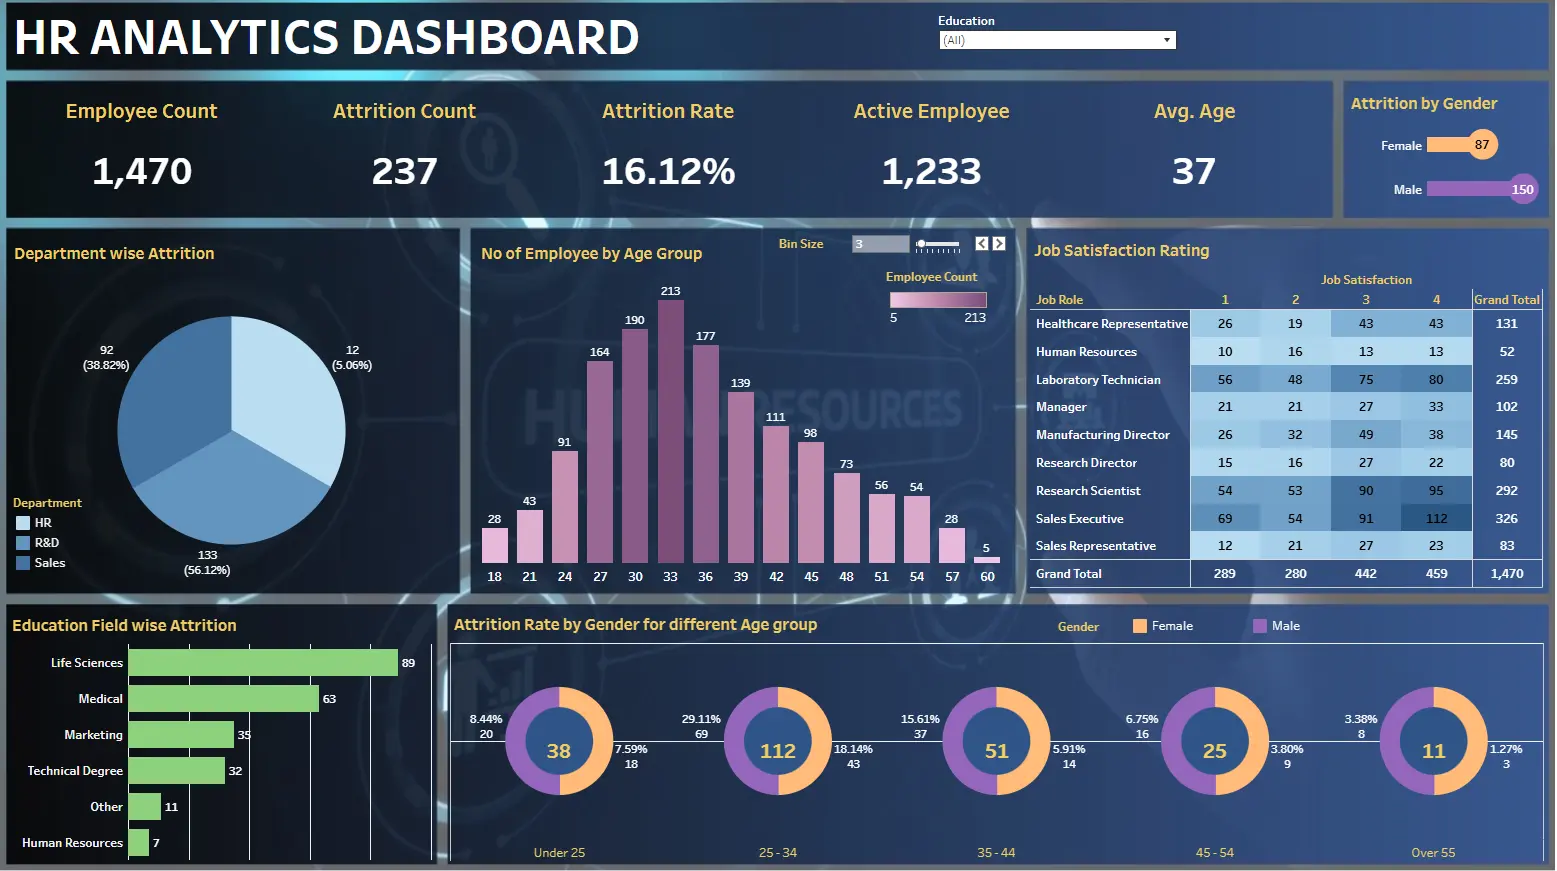
HR Analysis Intelligence Canvas
Secure Live Tableau Cloud Deployment Workspace ActiveStreaming Core Analytics Database Clusters...
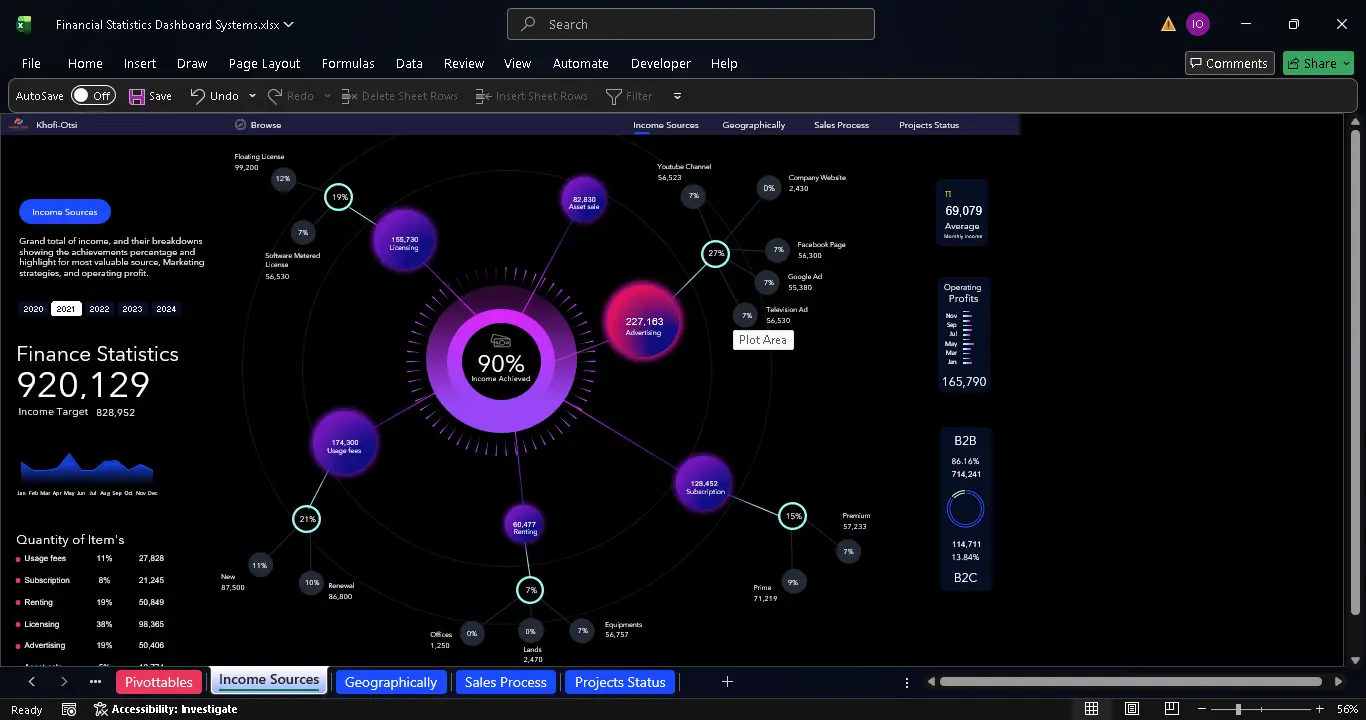
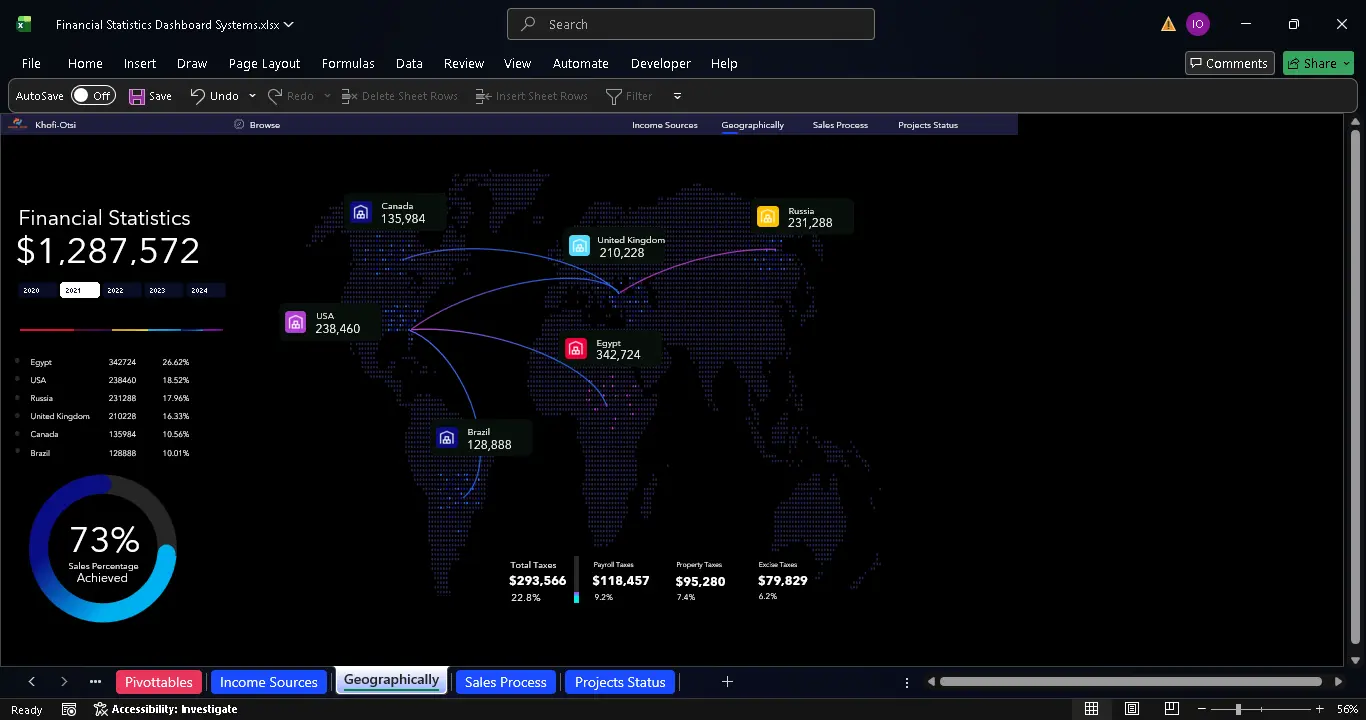
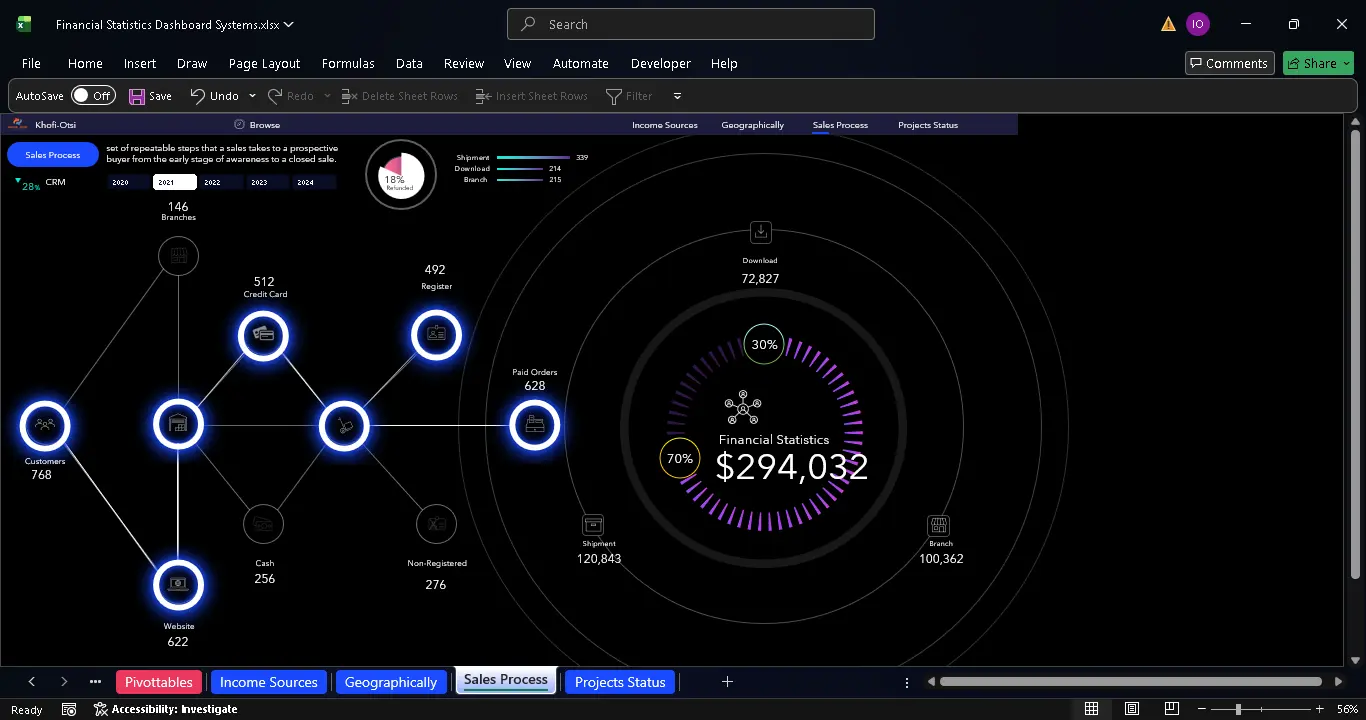
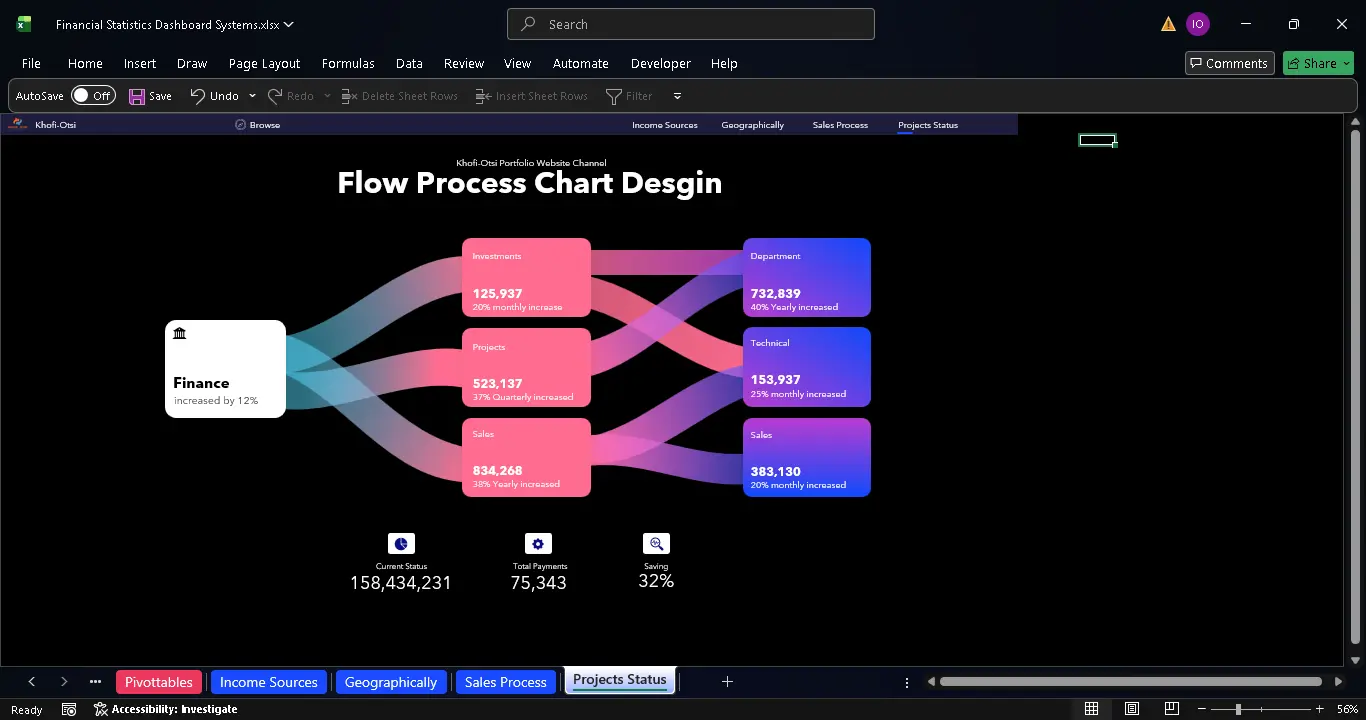
Executive Financial Statistics Suite Sandbox
Enterprise Data Protection Active (Downloads Restricted)Securing Sandbox Connection...
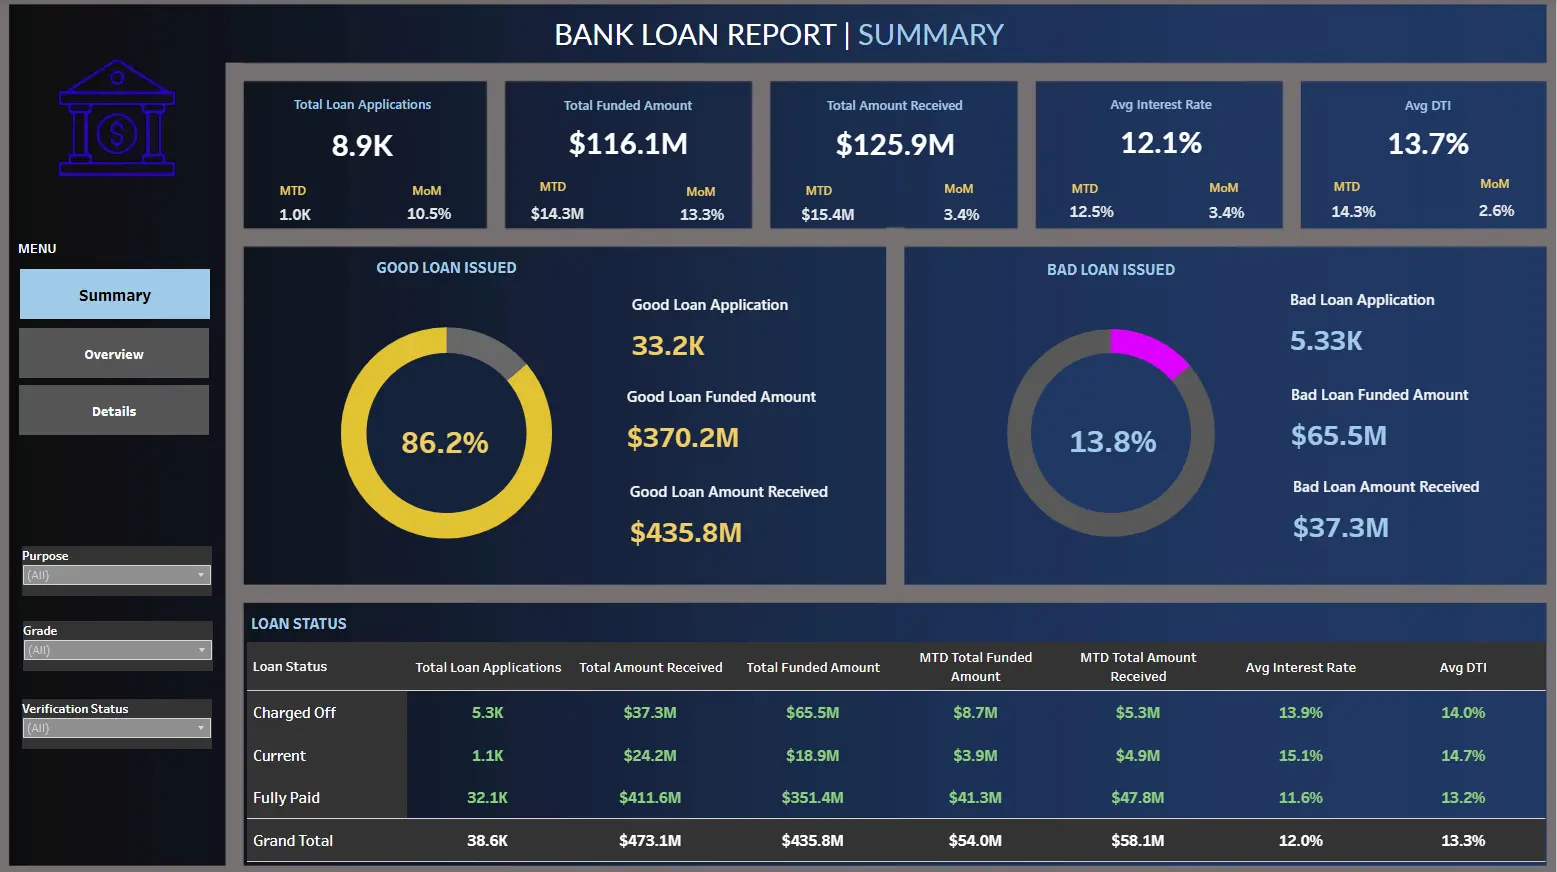
Bank Loan Intelligence Canvas
Secure Live Tableau Cloud Deployment Workspace ActiveStreaming Core Analytics Database Clusters...
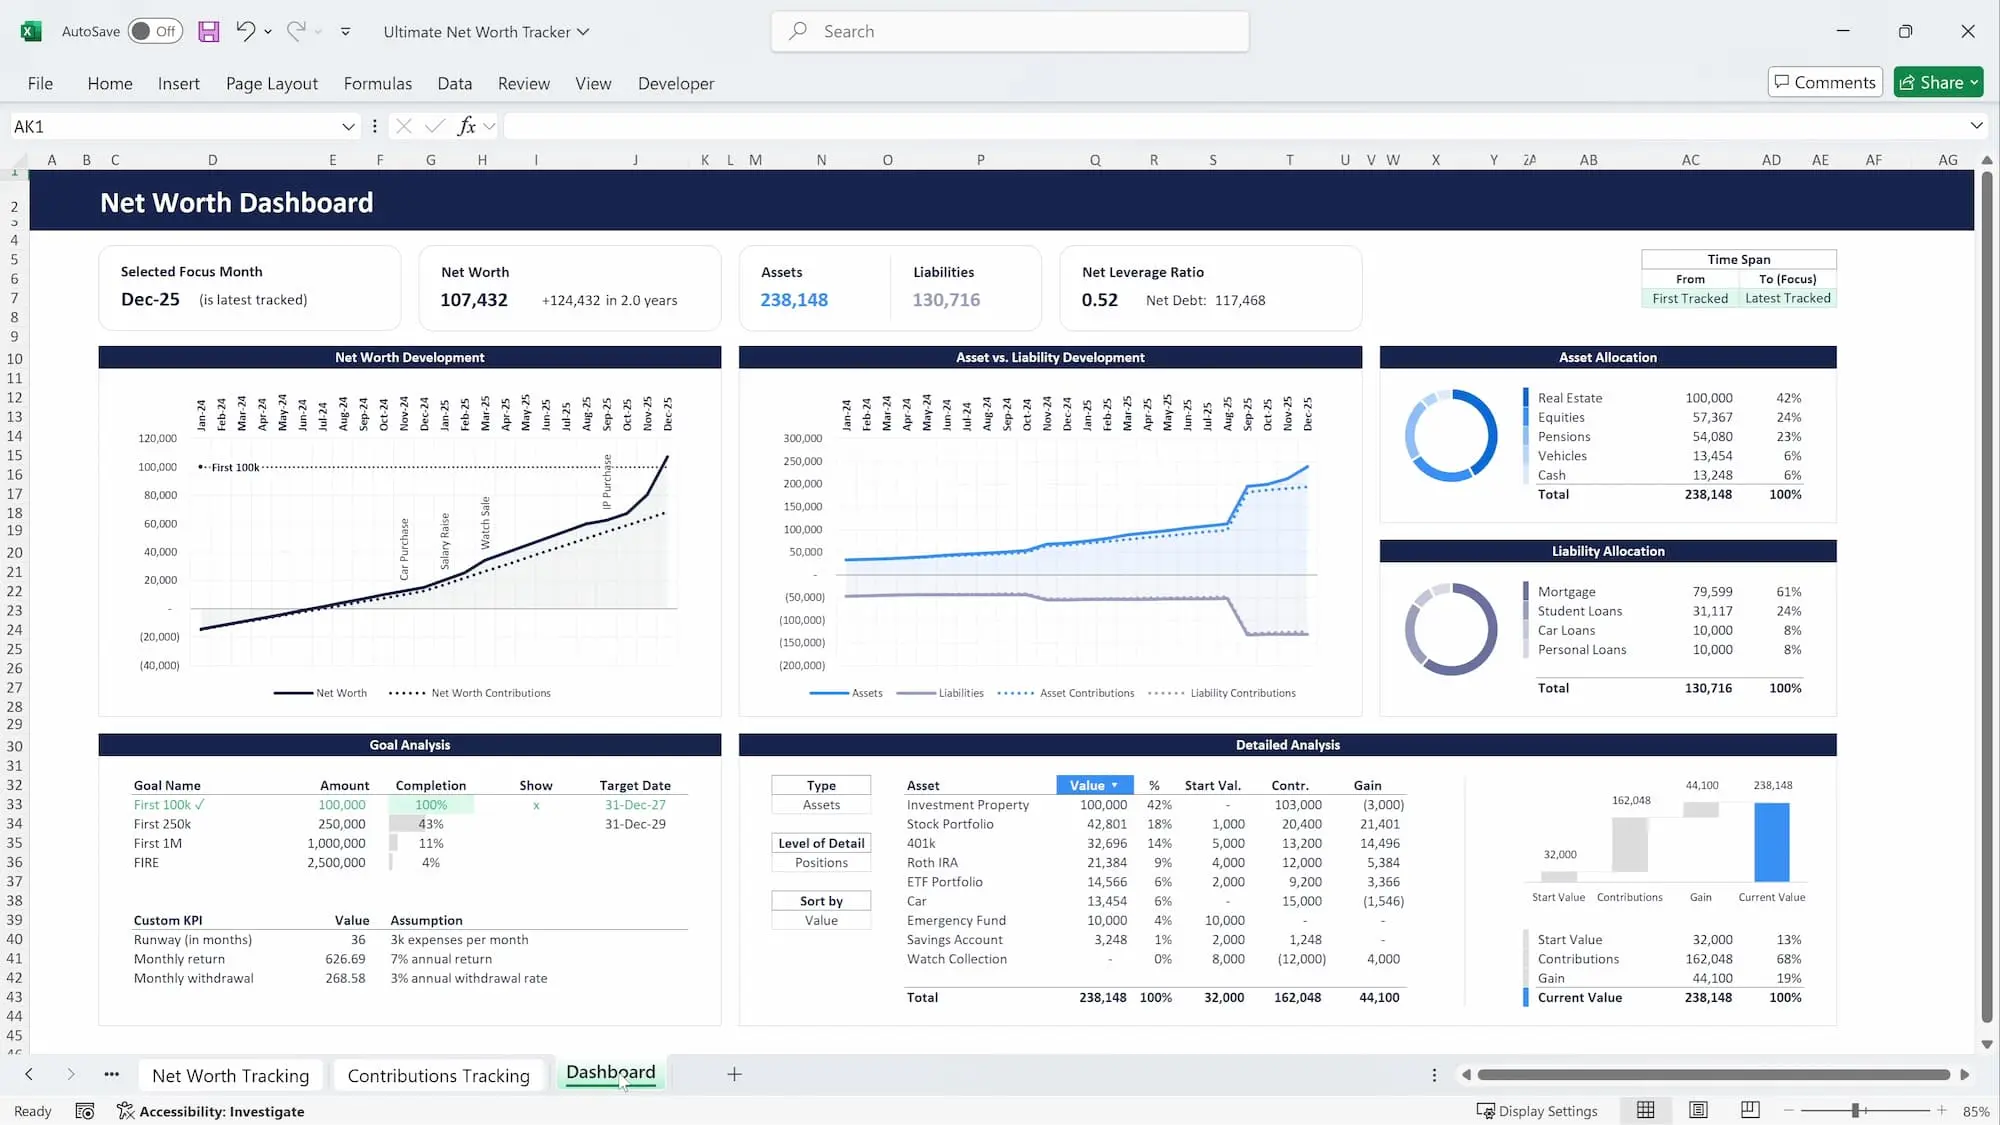

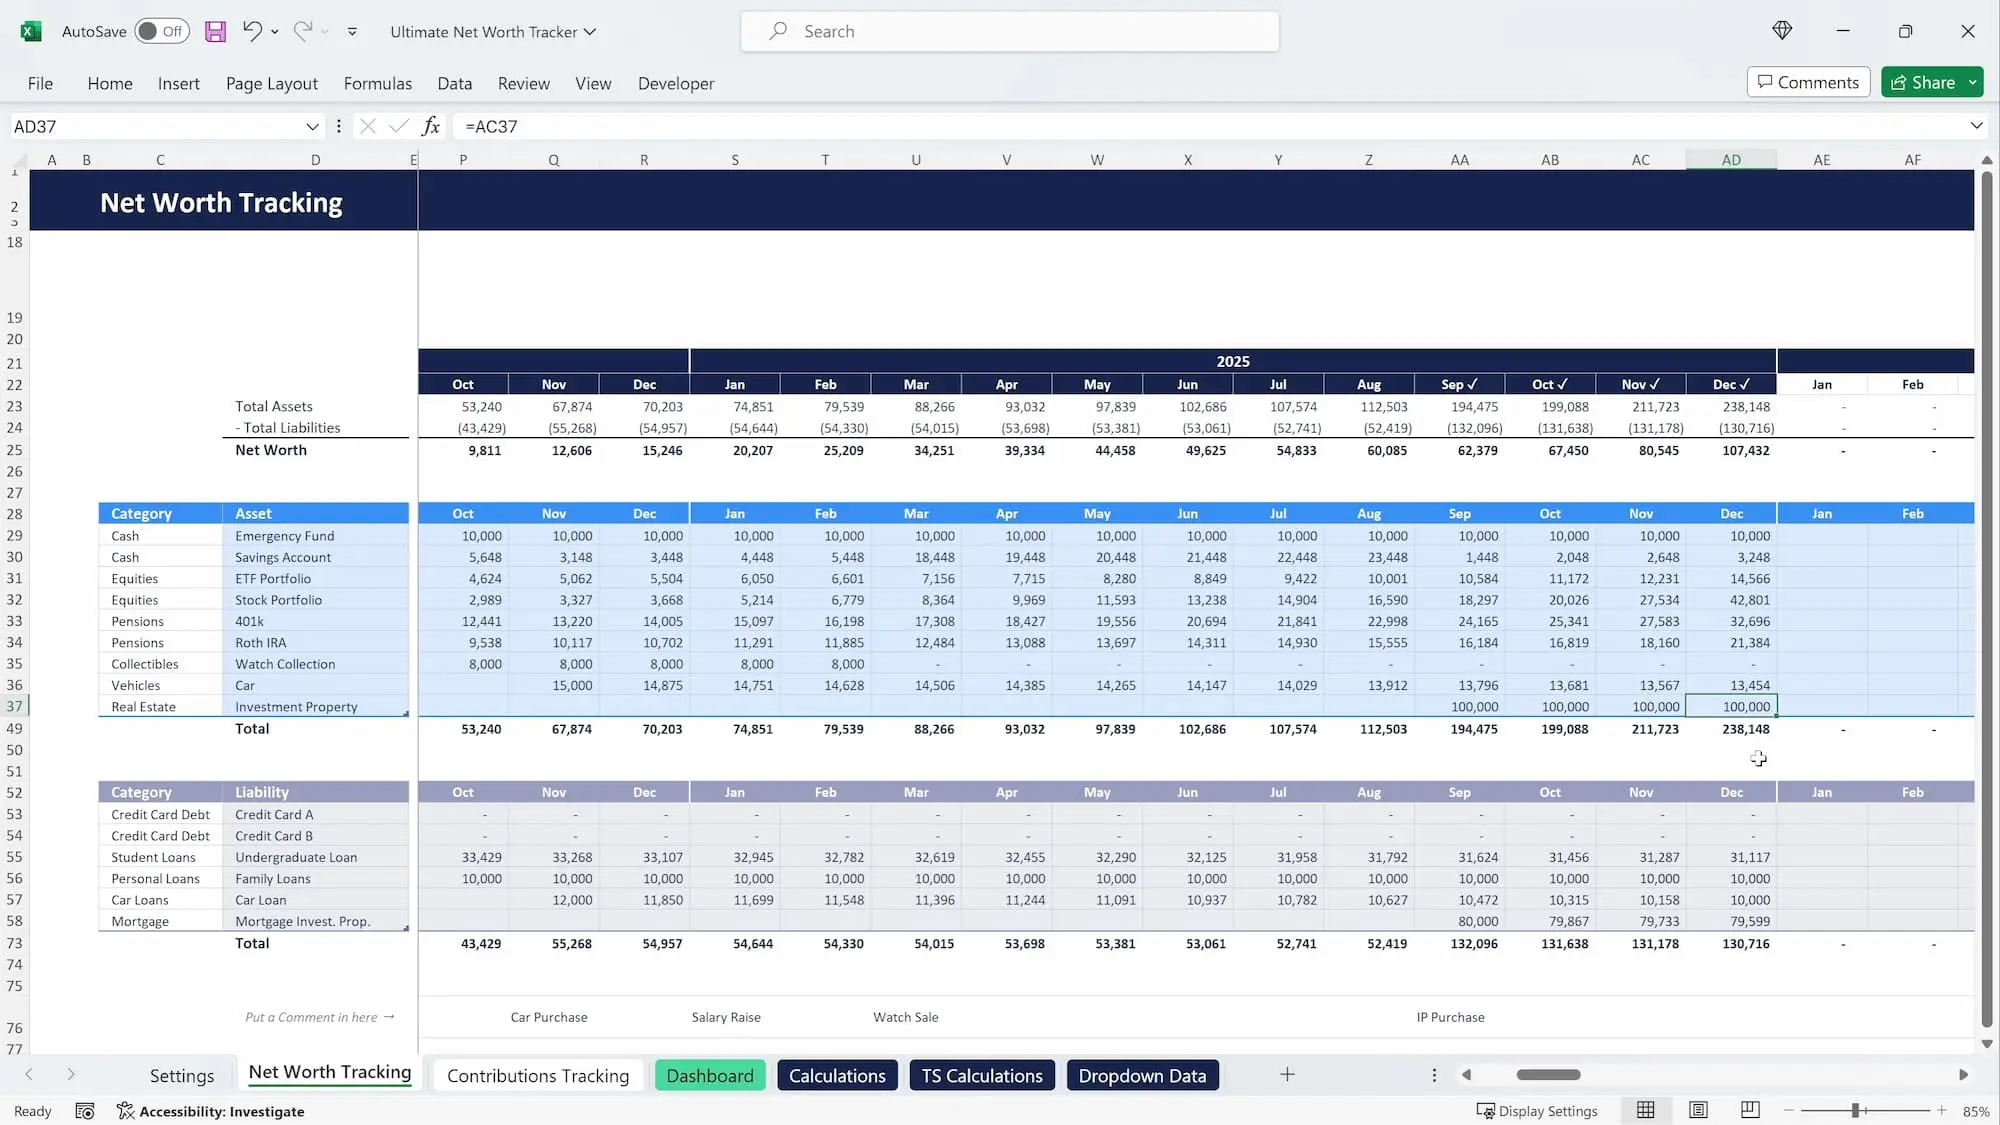
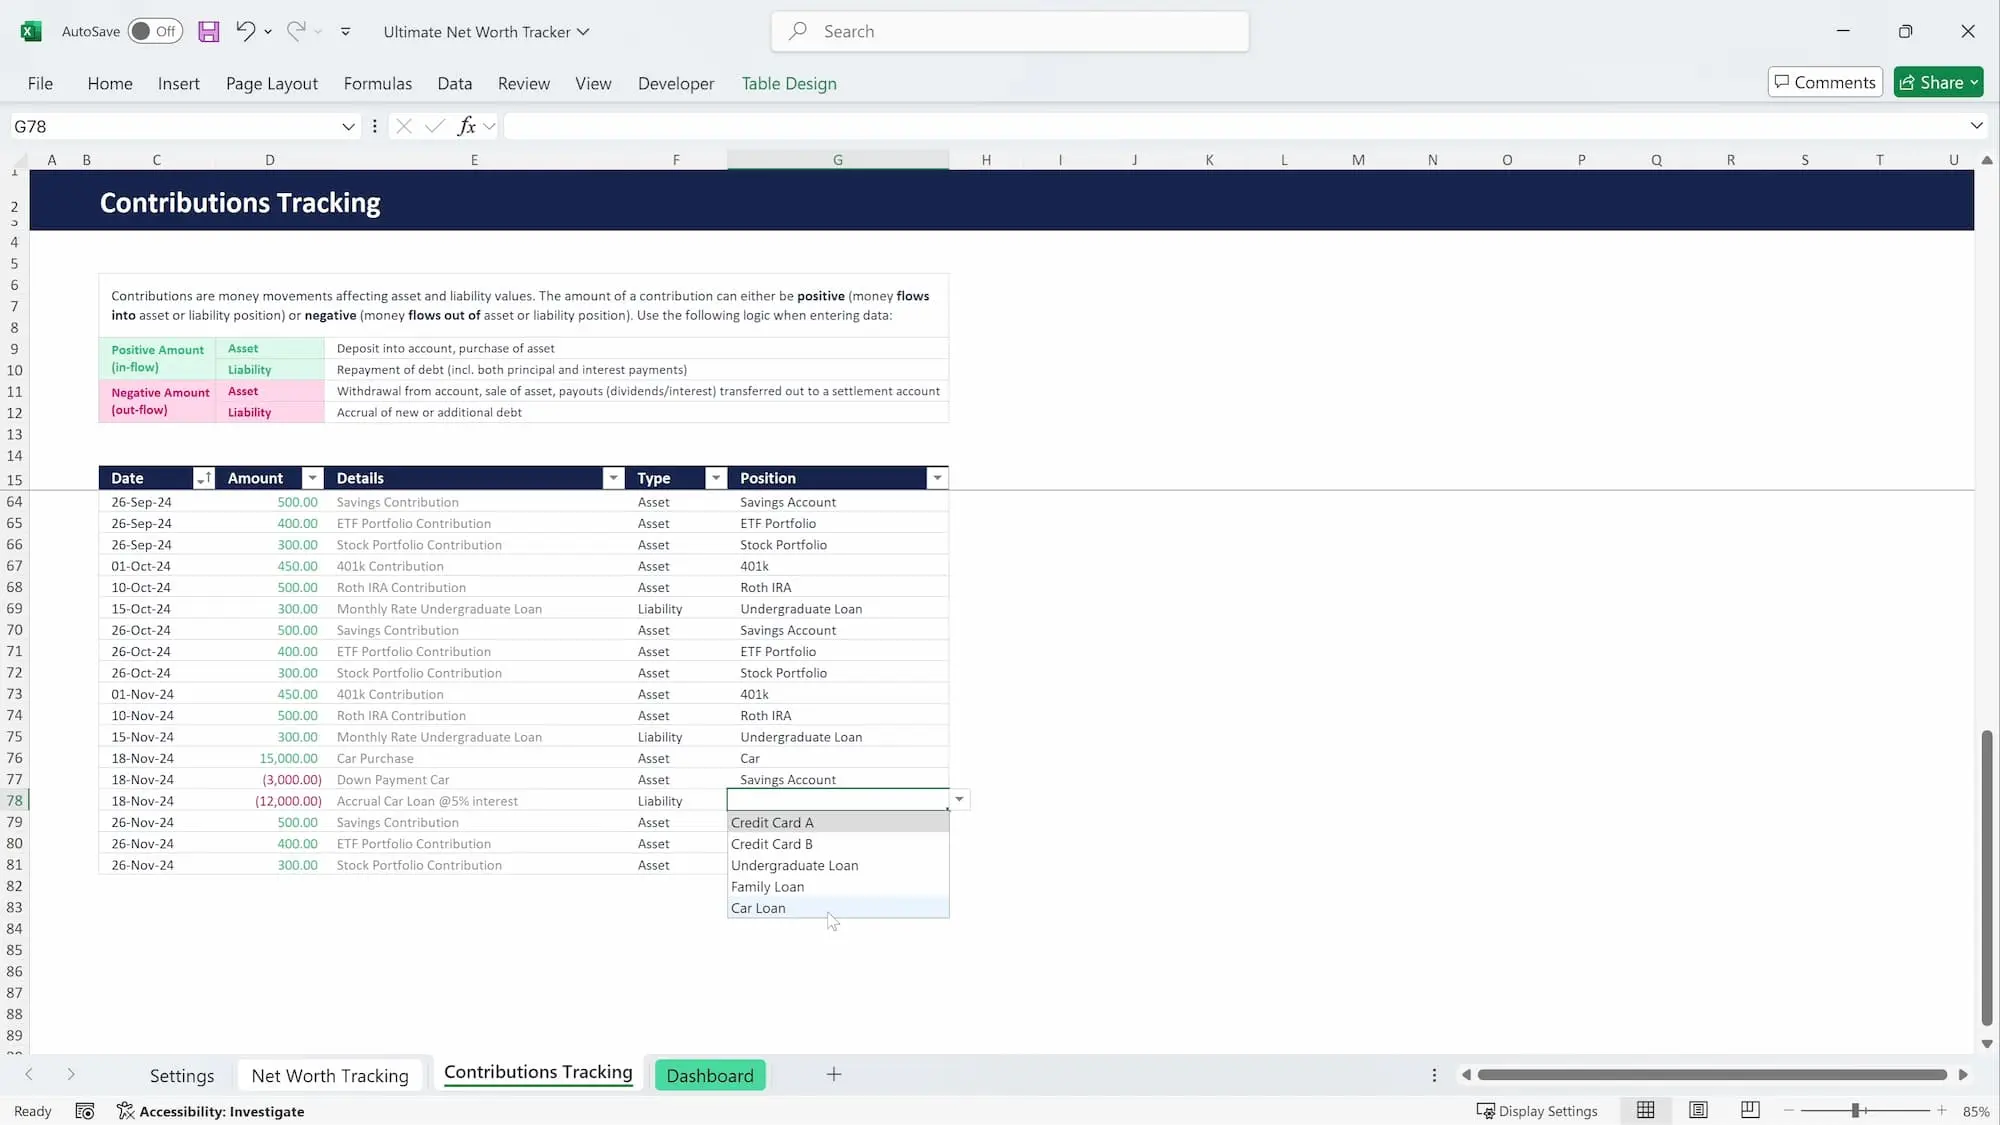
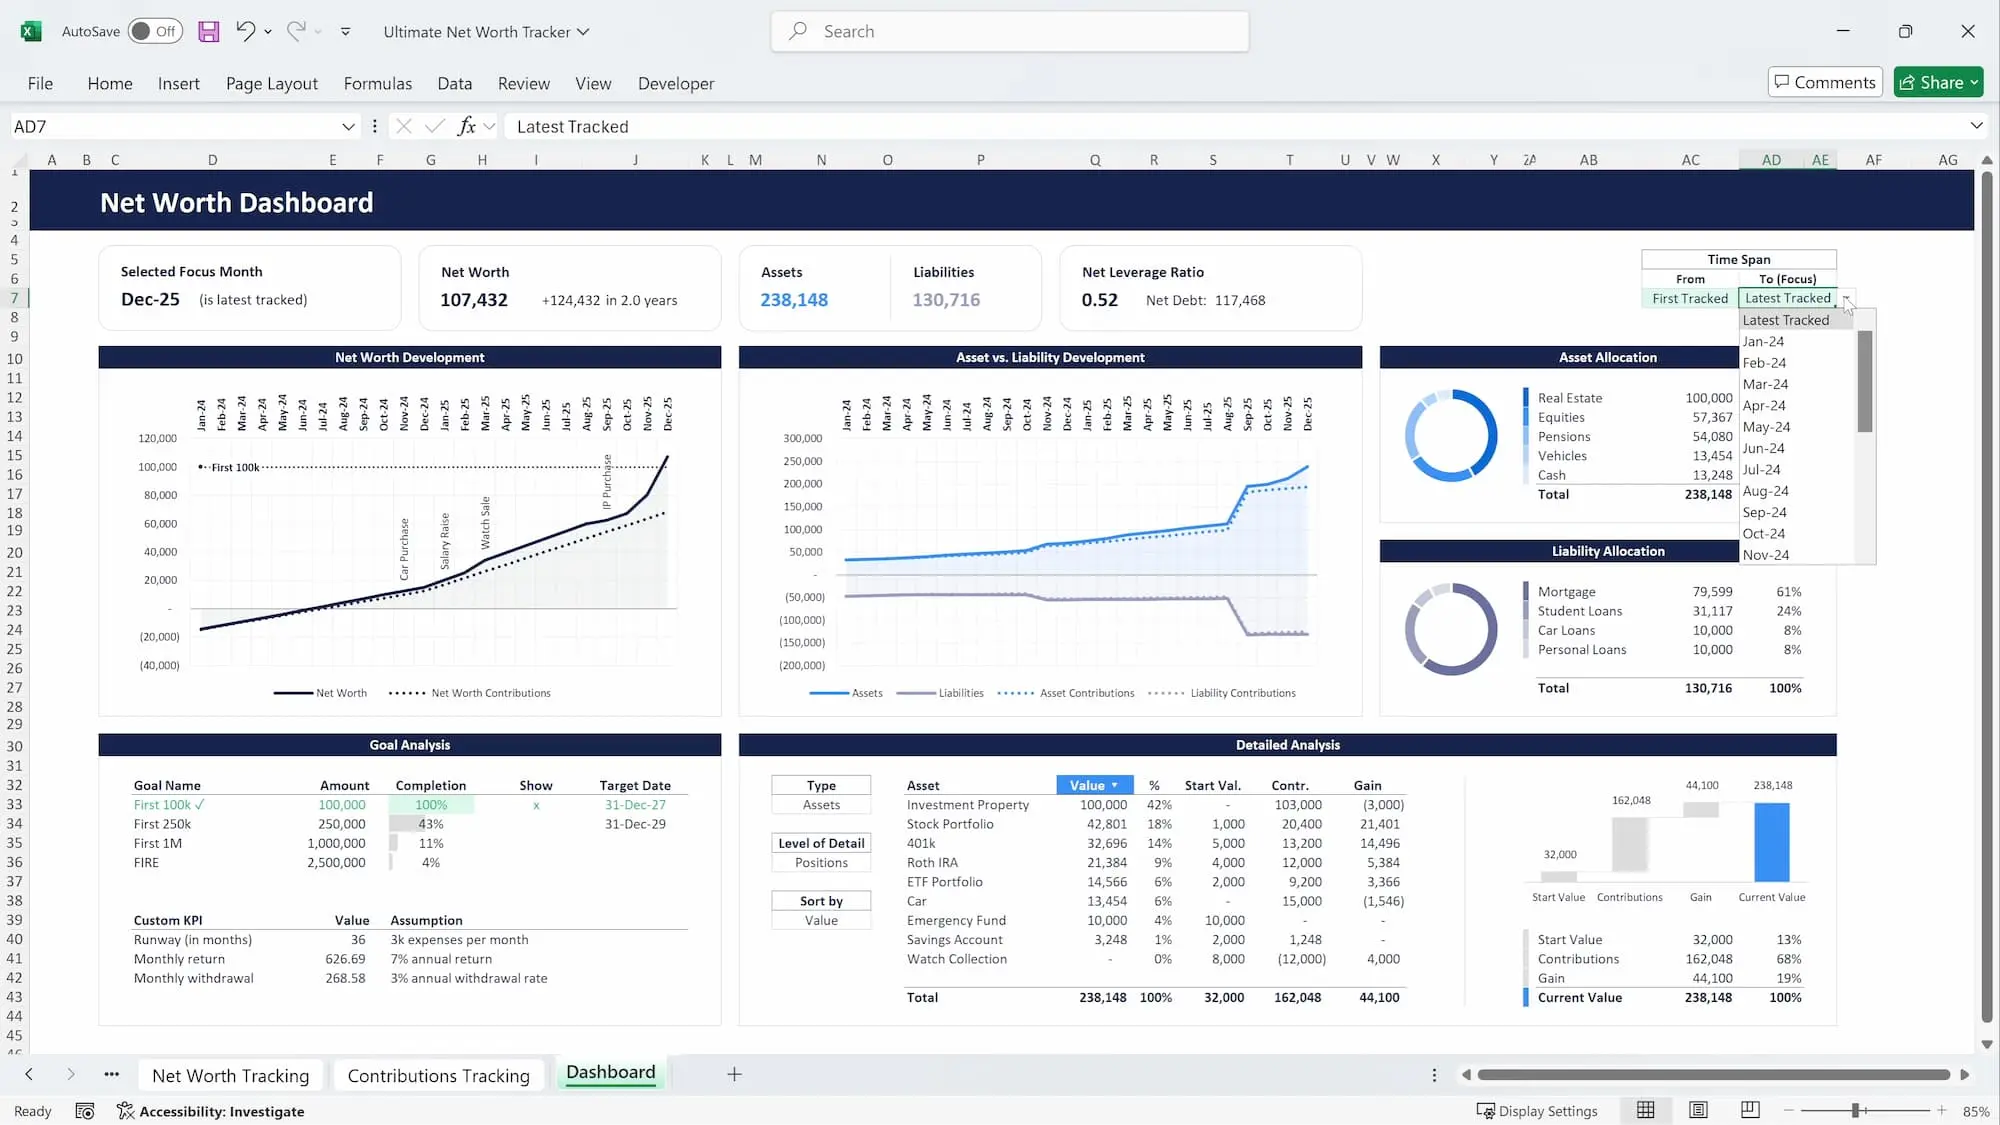
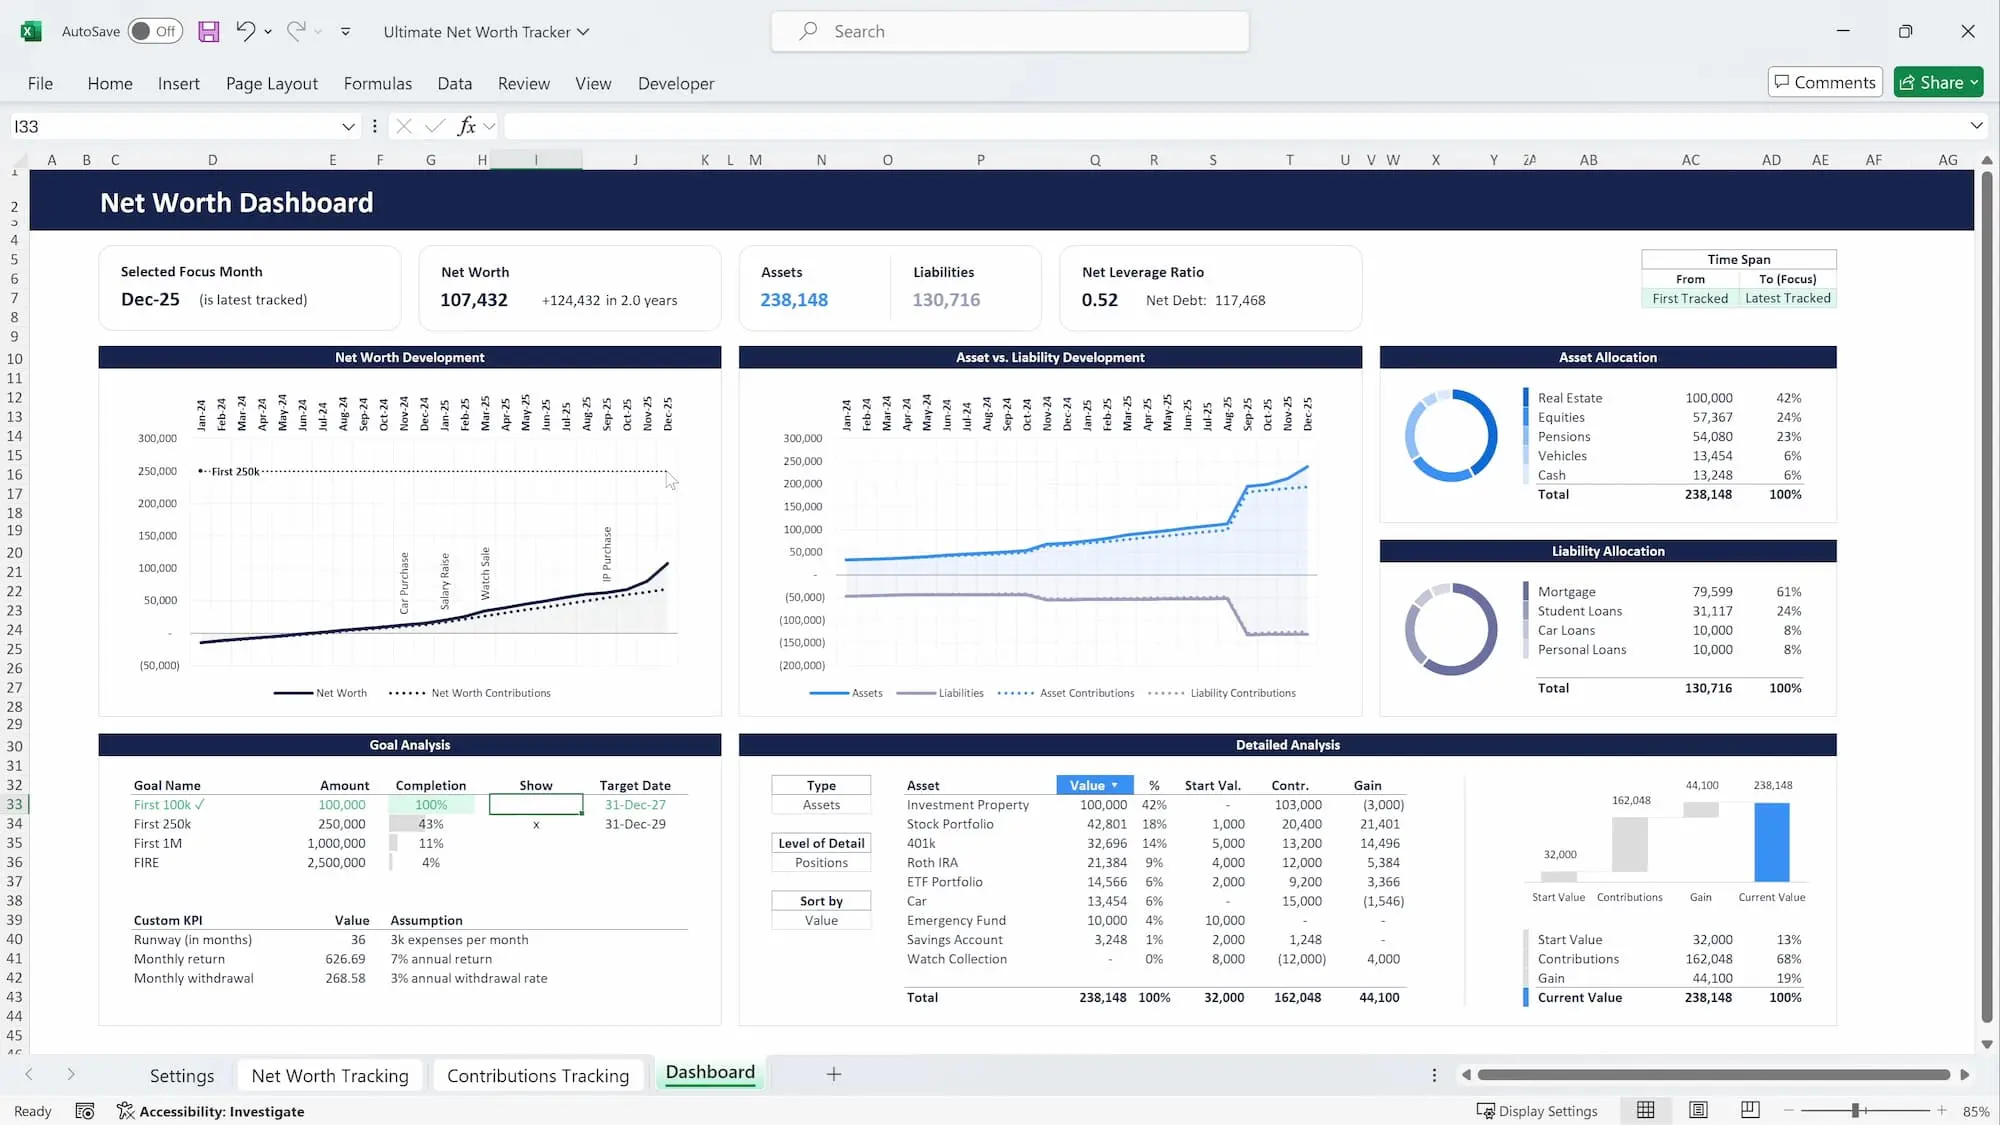
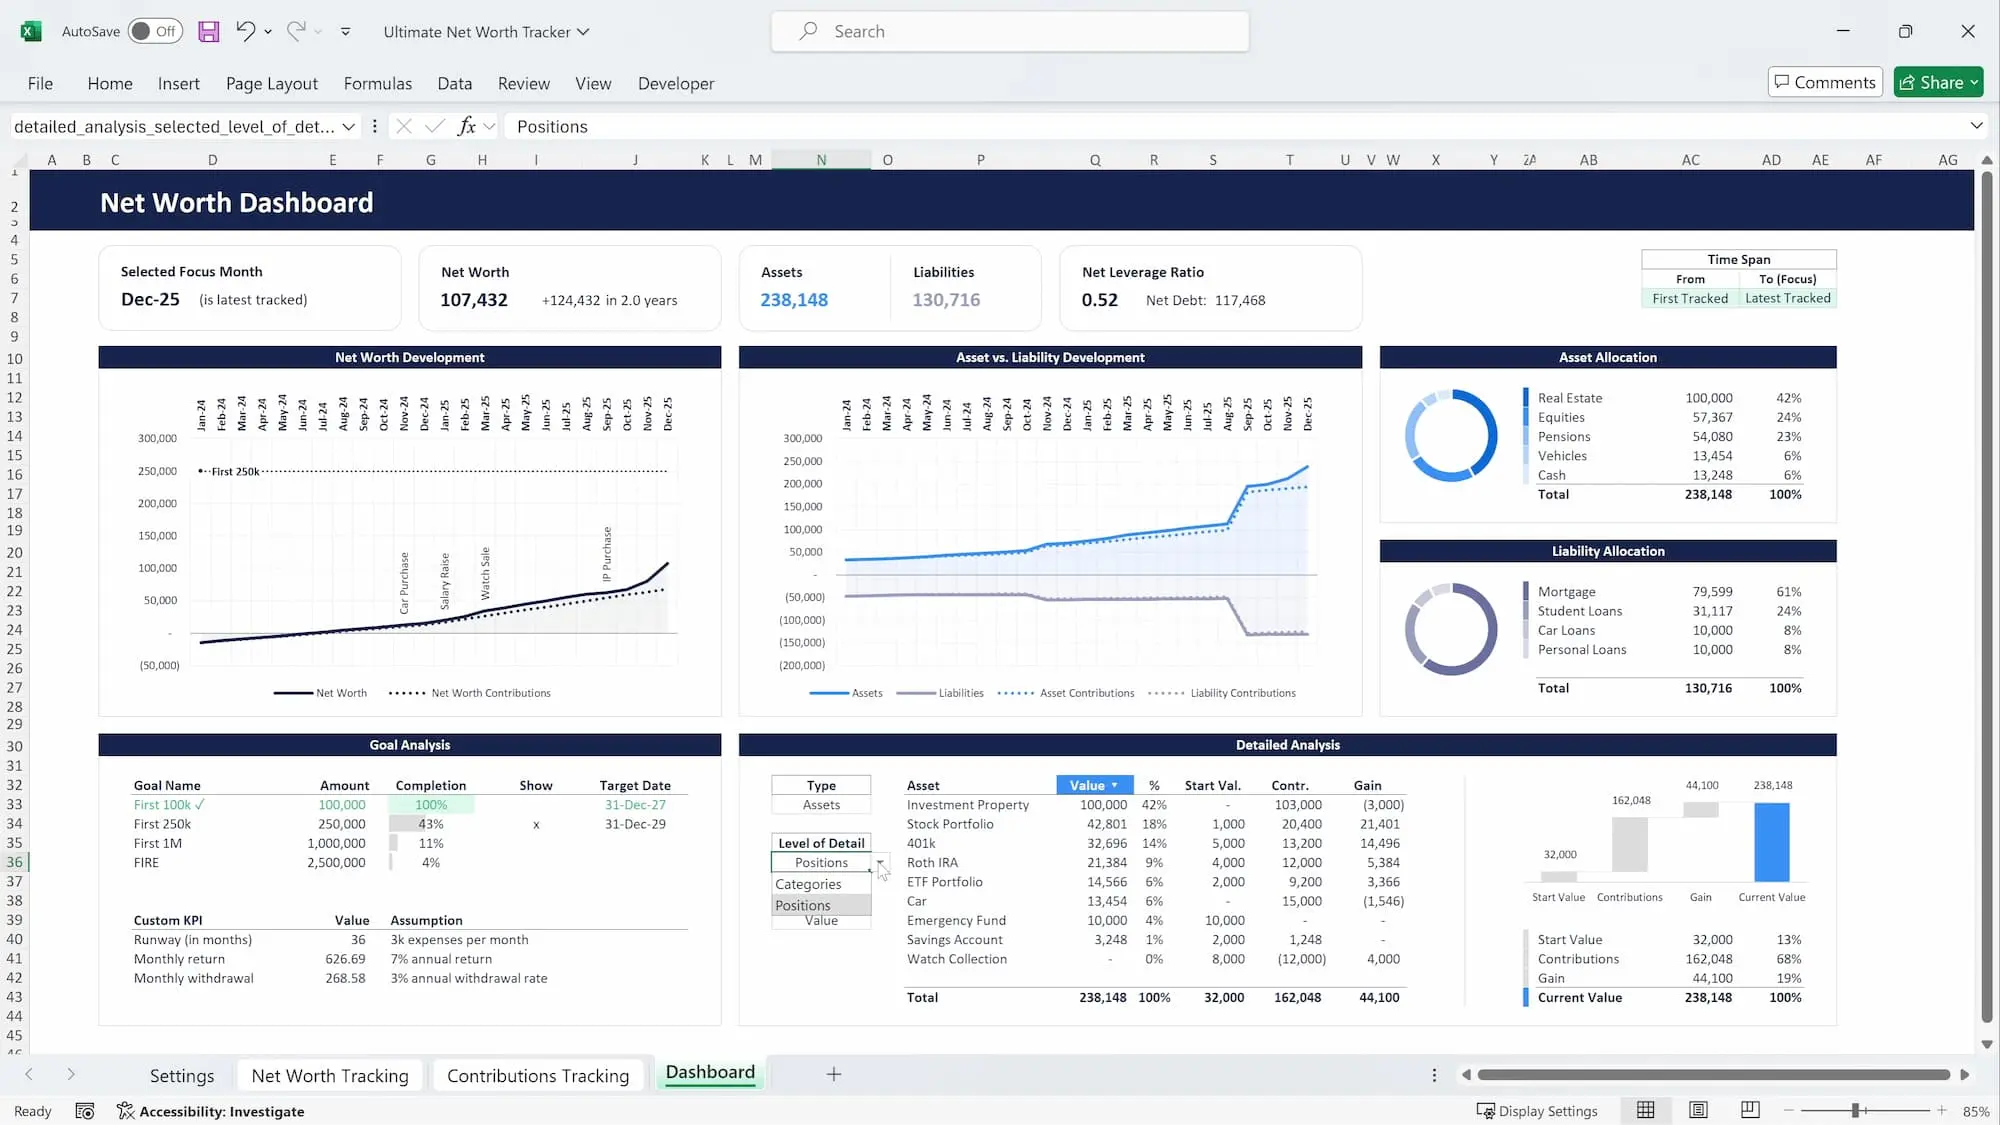
Net Worth Tracker Sandbox
Enterprise Data Protection Active (Downloads Restricted)Securing Sandbox Connection...
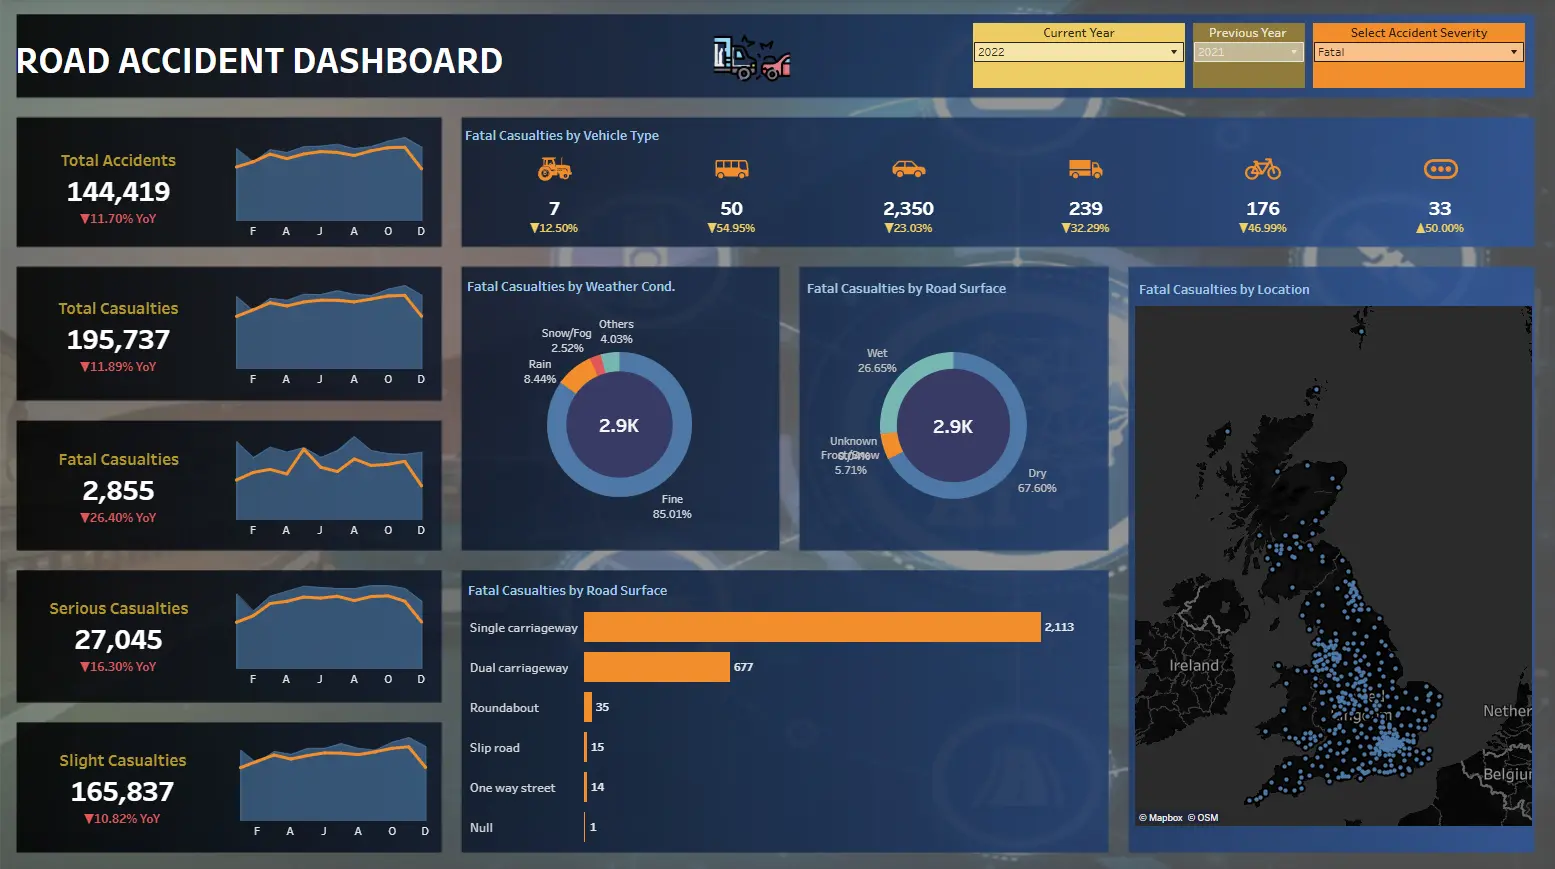
Traffic & Road Safety Analytics Intelligence Canvas
Secure Live Tableau Cloud Deployment Workspace ActiveStreaming Core Analytics Database Clusters...
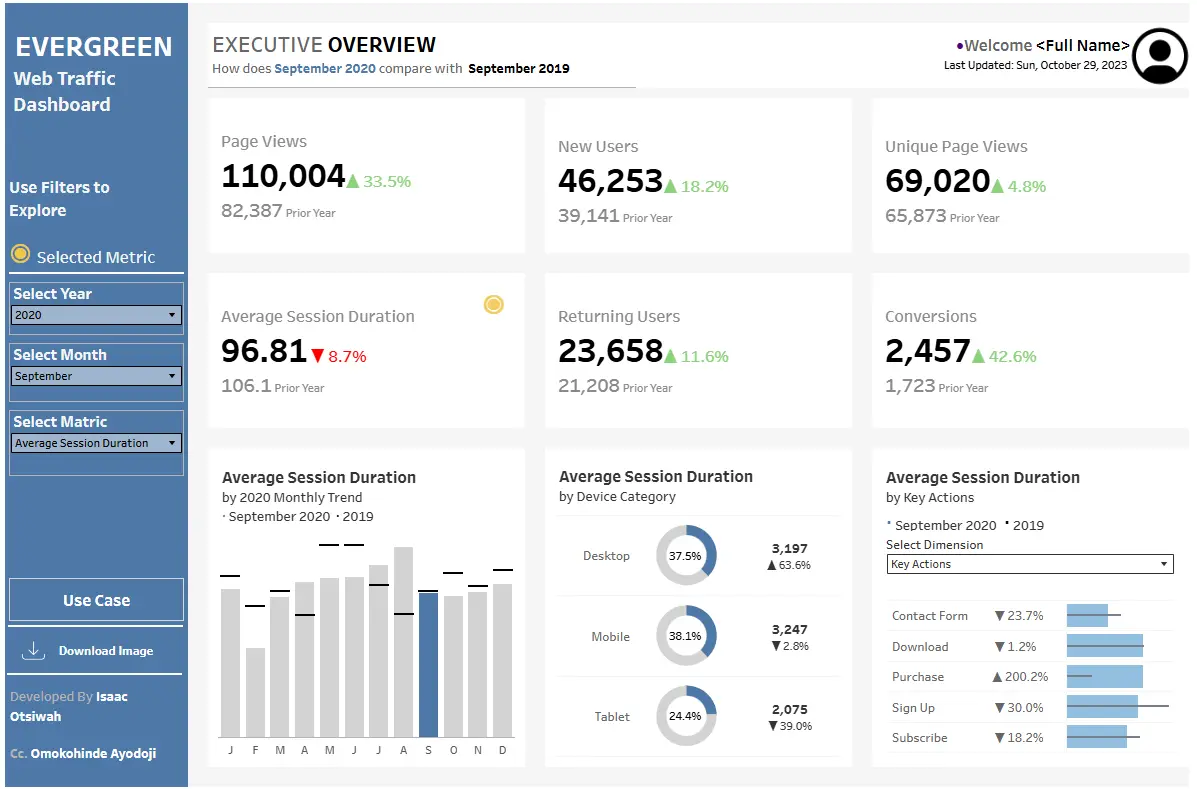
Web Traffic Intelligence Canvas
Secure Live Tableau Cloud Deployment Workspace ActiveStreaming Core Analytics Database Clusters...
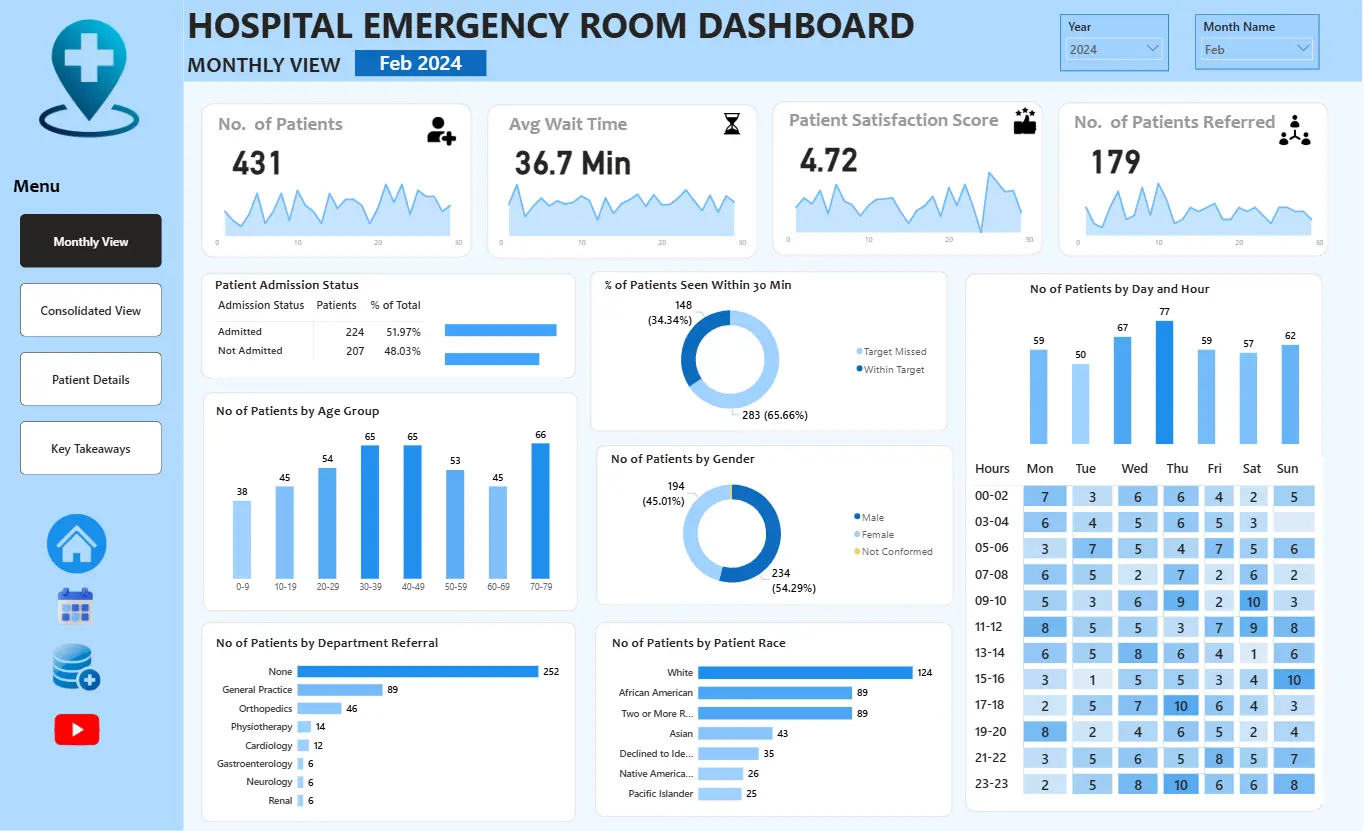
Hospital Emergency Room Dashboard
Interactive Power BI Engine Deployment ActiveConfiguring Business Intelligence Workspace...
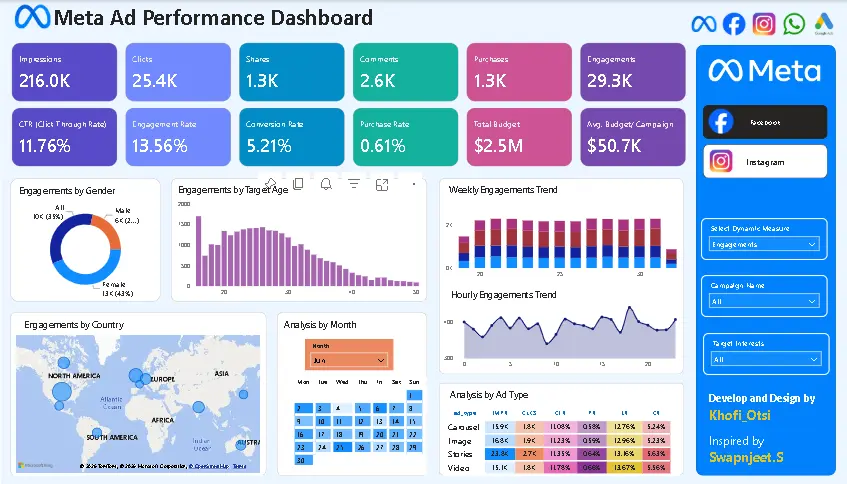
Meta Ad Performance Analysis
Consolidated cross-platform Facebook and Instagram campaign metrics to highlight high-converting ad sets and reduce wasted ad spend.
Meta Ad Performance Analysis Dashboard
Interactive Power BI Engine Deployment ActiveConfiguring Business Intelligence Workspace...
Isaac Otsiwah — Curriculum Vitae
Interactive Web Resume & PDF ExportLoading Curriculum Vitae...
Welcome to my Intelligence Hub ⚡
Quick QuestionTo optimize your viewing experience, what brings you to my portfolio today?
Case Study: Personal Finance Manager
🎯 Strategic Focus
The Objective
To build a fast, private personal finance dashboard that lets users track multi-currency income, manage category budgets, and forecast wealth without sending sensitive financial data to external servers.
⚡ The Challenge
The Problem & Complexity
Online finance tools risk exposing private records networks, while heavy calculations like currency conversion can make web pages laggy.
🏗️ How It Was Built (or System Architecture)
Engineering Pillars
Zero-Server Privacy
Stores and processes transactions locally in the browser, keeping financial data 100% private.
XSS Attack Protection
Uses strict text-rendering rules to block malicious code injection
Browser Security Headers
Enforces strict Content Security Policies (CSP) via Netlify to protect user
sessions
📈 Verified Impact
Business Value Delivered
100%
Data Isolation sandbox
<200ms
Load & Render Speed
Case Study: Ultimate Excel Gantt Chart
⚡ The Challenge
The Problem & Complexity
Standard Excel schedules often break when team members insert or delete rows, and heavy formatting can cause large spreadsheets to freeze.
🎯 Strategic Focus
The Objective
To create a reliable project management template in Excel that track multi-task schedules, maps task dependencies, and updates timelines automatically .
📈 Verified Impacts
Business Value Delivered
0%
Formula Errors
10x
Faster Schedule Visibility
🏗️ How It Was Built(or System Architecture)
Engineering Pillars
Dynamic Data Logic
Uses resilient cell formulas so deleting or moving rows never breaks timeline calculations.
Smooth Navigating Controls
Uses lightweight vector arrows for timeline scrolling without slowing down the sheet.
Lag-Free Formatting
Isolate conditional formatting rules so large project grids stay fast and responsive.
Case Study: Customer Churn Risk Model
🎯 Strategic Focus
The Objective
To build an early-warming analytics model that tracks customer engagement and flags accounts at risk of canceling.
⚡ The Challenge
The Problem & Complexity
Raw customer logs are messy, and tracking login drops, support tickets, and spending shifts manually often catches at-risk clients too late.
🏗️ How It Was Built (or System Architecture)
Model Pillars
Developed advanced mathematical matrices that prioritize heavy indicators (like sudden utilization drops) over minor temporary system anomalies, sorting data cleanly into clear, actionable risk tiers.
📈 Verified Impact
Proactive Revenue Protection
Early
Churn Detection
Hours
Saved in Manual Audits
Weighted Risk Scoring
Prioritizes major warming signs(like sudden usage drops) over minor dips to group accounts into clear risk tiers.
Executive Visual Report
Presents insights in a clean, light/dark-mode dashboard designed for fast review by retention teams.
Testimonials

Ekow Mensah
Technical Product ManagerAn exceptional engineer who prioritizes application security and runtime efficiency. He delivered a zero-server interface ahead of schedule with modular, strict JavaScript architecture that is remarkably easy to maintain.
Impact: 100% Data Isolation & <200ms
Payloads

Paula Vusy
Operations Director, Retail GroupTransformed over 10,000 messy transactional logs into an effortless, executive-ready Power BI dashboard. His deep understanding of DAX modeling quickly uncovered critical inventory bottlenecks we didn't know existed.
Impact: Uncovered LTV trends across 10k+
rows

Kwame Asare
Project Management LeadPossesses a rare combination of structural calculation logic and sharp UI layout design. He automated our broken tracking systems, engineering a resilient workflow engine that completely eliminated human scheduling conflicts.
Impact: 0% Formula Fragmentation on
corporate grids